
Planet Python
Tryton News: Tryton Release 7.4
We are proud to announce the 7.4 release of Tryton .
This release provides many bug fixes, performance improvements and some fine tuning.
You can give it a try on the demo server, use the docker image or download it here.
As usual upgrading from previous series is fully supported.
Here is a list of the most noticeable changes:
Changes for the User ClientsThe Many2Many widget now has a restore button to revert the removal of records before saving.
The CSV export window stays open after the export is done so you can refine your export without having the redo all of the configuration.
It also supports exporting and importing translatable fields with a language per column.
The error messages displayed when there is a problem with the CSV import have been improved to include the row and column number of the value that caused the error.
The management window for the favourites has been removed and replaced by a simple “last favorite first” order.
The focus goes back to the search entry after performing a search/refresh.
You can now close a tab by middle clicking on it (as is common in other software).
Web ClientThe left menu and the attachment preview can now be resized so the user can make them the optimal size for their screen.
AccountingThe minimal chart of accounts has been replaced by the a universal chart of accounts which is a good base for IFRS and US GAAP.
It is now possible to copy an accounting move from a closed period. The closed period will be replaced by the current period after accepting the warning.
The payments are now numbered to make it easier to identify them inside the application.
An option has been added to the parties to allow direct debits to be created based on the balance instead of the accounting lines.
We’ve added a button on the Stripe payments and Stripe and Braintree customers to allow an updated to be forced. This helps when fixing missed webhooks.
When a stock move is cancelled, the corresponding stock account move is now cancelled automatically.
But it now no longer possible to cancel a done stock move which has been included in a calculation used for anglo-saxon accounting.
It is now possible to deactivate an agent so that they are no longer used for future orders.
CompanyIt is now possible to add a company logo. This is then displayed in the header of generated documents.
IncotermA warning is now raised when the incoterm of a shipment is different from the original document (such as the sale or purchase).
PartyWe’ve added more identifiers for parties like the United Kingdom Unique Taxpayer Reference, Taiwanese Tax Number, Turkish tax identification number, El Salvador Tax Number, Singapore’s Unique Entity Number, Montenegro Tax Number and Kenya Tax Number.
ProductWe’ve added a wizard to manage the replacement of products. Once there is no more stock of the replaced product in any of the warehouses, all the stock on all pending orders are replaced automatically.
A description can now be set for each product image.
There is now a button on the price list form to open the list of lines. This is helpful when the price list has a lot of lines.
ProductionIt is now possible to cancel a done production. All its stock moves are then cancelled.
The Bill of Materials now have an auto-generated internal code.
PurchaseThe wizard to handle exceptions has been improved to clearly display the list of lines to recreate and the list of lines to ignore.
The menu entry Parties associated to Purchases has been removed in favour of the per party reporting.
The purchase amendment now supports amending the quantity of a purchase line using the secondary unit.
QualityIt is now no longer possible to delete non-pending inspections.
SaleThe wizards to handle exceptions have been improved to clearly display the list of lines to recreate and the list of lines to ignore.
The menu entry Parties associated to Sales has been removed in favor of the per party reporting.
A warning is now raised when the user tries to submit a complaint for the same origin as an existing complaint.
The reporting can be grouped per promotion.
From a promotion, it is now possible to list of the sales related to it.
The coupon number of promotion can now be reused once the previous promotion has expired.
The sale amendment now supports amending the quantity of a sale line using the secondary unit.
StockIt is now possible to cancel a done shipment. When this happens the stock moves of the shipment are cancelled.
The task to reschedule late shipments now includes any shipment that is not yet done.
The supplier shipments no longer have a default planned date.
The customer shipments now have an extra state, Shipped, before the Done state.
The lot trace now shows the inventory as a document.
The package weight and the warehouse are now criteria that can be used when selecting a shipping method.
Changes for the System AdministratorThe clients automatically retry 5 times on a 503 Service Unavailable response. They respect the Retry-After value if it is set in the response header. This is useful when performing short maintenance on the server without causing an interruption for the users.
The scheduled tasks now show when they are running and prevent the user from editing them (as they are locked anyway).
We also store their last duration for a month by default. So the administrator can analyze and find slow tasks.
It is now possible to configure a license key for the TinyMCE editor.
Also TinyMCE has been updated to version 7.
It is now possible to configure the command to use to convert a report to a different format. This allows the use of an external service like document-converter.
AccountingThe Accounting Party group has been merged into the *Accounting" group.
We now raise a warning when the user is changing one of the configured credentials used on external services. This is to prevent accidental modification.
Document IncomingIt is now possible to set a maximum size for the content of the document incoming requests.
Inbound EmailIt is now possible to set a maximum size for the inbound email requests.
Web ShopThere is now a scheduled task that updates the cache that contains the product data feeds.
Changes for the Developer ServerThe ORM supports SQL Range functions and operators to build exclusion constraints. This allows, for example, the use of non-overlapping constraints using an index.
On PostgreSQL the btree_gist extension may be needed otherwise the ORM will fallback to locking querying the table.
The SQLite backend adds simple SQL constraints to the table schema.
The relational fields with a filter are no longer copied by default. This was a frequent source of bugs as the same relational field without the filter was already copied so it generated duplicates.
We’ve added a sparkline tool to generate textual sparklines. This allows the removal of the pygal dependency.
The activate_modules from testing now accepts a list of setup methods that are run before taking the backup. This speeds up any other tests which restore the backup as they then do not need to run those setup methods.
The backend now has a method to estimate the number of rows in a table. This is faster than counting when we only need an estimate, for example when choosing between a join and a sub-query.
We’ve added a ModelSQL.__setup_indexes__ method that prepares the indexes once the Pool has been loaded.
It is now possible to generate many sequential numbers in a single call. This allows, for example, to number a group of invoices with a single call.
The backend now uses JSONB by default for MultiSelection fields. It was already supported, but the database needed to be altered to activate the feature.
You can now define the cardinality (low, normal or high) for the index usage. This allows the backend to choose an optimal type of index to create.
We now have tools that apply the typing to columns of an SQLite query. This is needed because SQLite doesn’t do a good job of supporting CAST.
The RPC responses are now compressed if their size if large enough and the client accepts it.
The ModelView._changed_values and ModelStorage._save_values are now methods instead of properties. This makes it is easier to debug errors because AttributeError exceptions are no longer hidden.
The scheduled task runner now uses a pool of processes for better parallelism and management. Only the running task is now locked.
We’ve added an environment variable TEST_NETWORK so we can avoid running tests that require network access.
There is now a command line option for exporting translations and storing them as a po file in the corresponding module.
Tryton sets the python-format flag in the po file for the translations containing python formats. This allows Weblate (our translation service) to check if the translations keep the right placeholders.
The payment amounts are now cached on the account move line to improve the performance when searching for lines to pay.
The payment amounts now have to be greater or equal to zero.
Only purchase lines of type line can be used as an origin for a stock move.
SaleOnly sales lines of type line can be used as an origin for a stock move.
The fields from the Sale Shipment Cost Module are now all prefixed with sale_.
StockCancelled moves are no longer included in the shipment and package measurements.
2 posts - 1 participant
Django Weblog: Django bugfix release issued: 5.1.3
Today we've issued the 5.1.3 bugfix release.
The release package and checksums are available from our downloads page, as well as from the Python Package Index. The PGP key ID used for this release is Mariusz Felisiak: 2EF56372BA48CD1B.
Python Engineering at Microsoft: Announcing GitHub Copilot in Data Wrangler
AI did not write this blog post, but it will make your exploratory data analysis with Data Wrangler better!
Today, we’re excited to introduce our first step of integrating the power of Copilot into Data Wrangler.
With this first integration of Copilot with Data Wrangler, you’ll be able to:
- Use natural language to clean and transform your data
- Get help with fixing errors in your data transformation code
An example of using Copilot in Data Wrangler to filter for listings that allow dogs/cats
A common limitation of using AI tools for exploratory data analysis tasks today is the lack of data context provided to the AI. Responses are typically more generalized and not tailored to the specific task or data at hand. In addition, there’s always the manual and tedious task of verifying the correctness of the generated code.
What makes Copilot with Data Wrangler different is twofold. First, this integration allows you to choose to provide Copilot with your data context, enabling it to generate more relevant and specific code for the exact dataset you have open. Second, you get to preview the exact behavior of the code on your dataset with the Data Wrangler interface to visually validate Copilot’s response, along with all the benefits that the Data Wrangler tool provides.
Data transformationsWith Copilot in Data Wrangler, you can ask it to perform ambiguous, open-ended transformations or a specific task you have in mind. Below we’ve included three examples of the many possibilities you can achieve with Copilot in Data Wrangler:
Formatting a datetime column
Removing any column(s) with over 40% missing values
Fixing an error in a data transformation
Getting started todayTo use Copilot with Data Wrangler, you will need the following 3 prerequisites.
- You must have the Data Wrangler extension for VS Code installed.
- You must have the GitHub Copilot extension for VS Code installed.
- You must have an active subscription for GitHub Copilot in your personal account, or you need to be assigned a seat by your organization. Sign up for a GitHub Copilot free trial in your personal account.
Follow these steps to Set up GitHub Copilot in VS Code.
Once the prerequisites are met, you will see the Copilot interface within Data Wrangler by default (customizable in the Data Wrangler settings) when you are in Editing Mode. You can then either select the input box or use the default Copilot keyboard shortcut of CMD/CTRL + I.
Responsible AIAI is not perfect (neither are we!) and it will improve over time. Microsoft and GitHub Copilot follow Responsible AI principles and employ controls to ensure that your experience with the service is appropriate, pleasant, and useful. We understand there is hesitation and concern surrounding the rapid expansion of AI’s capabilities, and fully respect those who don’t want or can’t use Copilot.
If you have any feedback around the Copilot experience in Data Wrangler, please file an issue in our Data Wrangler public GitHub repository here.
Next StepsWe are just getting started. This is the first experience in Data Wrangler that we are enhancing with Copilot. Stay tuned for more AI-powered experiences in Data Wrangler to help with your data analysis needs soon!
The post Announcing GitHub Copilot in Data Wrangler appeared first on Python.
Real Python: Variables in Python: Usage and Best Practices
In Python, variables are symbolic names that refer to objects or values stored in your computer’s memory. They allow you to assign descriptive names to data, making it easier to manipulate and reuse values throughout your code.
Understanding variables is key for Python developers because variables are essential building blocks for any Python program. Proper use of variables allows you to write clear, readable, and maintainable code.
In this tutorial, you’ll learn how to:
- Create and assign values to variables
- Change a variable’s data type dynamically
- Use variables to create expressions, counters, accumulators, and Boolean flags
- Follow best practices for naming variables
- Create, access, and use variables in their scopes
To get the most out of this tutorial, you should be familiar with Python’s basic data types and have a general understanding of programming concepts like loops and functions.
Don’t worry if you don’t have all this knowledge yet and you’re just getting started. You won’t need this knowledge to benefit from working through the early sections of this tutorial.
Get Your Code: Click here to download the free sample code that shows you how to use variables in Python.
Take the Quiz: Test your knowledge with our interactive “Variables in Python: Usage and Best Practices” quiz. You’ll receive a score upon completion to help you track your learning progress:
Interactive Quiz
Variables in Python: Usage and Best PracticesIn this quiz, you'll test your understanding of variables in Python. Variables are symbolic names that refer to objects or values stored in your computer's memory, and they're essential building blocks for any Python program.
Getting to Know Variables in PythonIn Python, variables are names associated with concrete objects or values stored in your computer’s memory. By associating a variable with a value, you can refer to the value using a descriptive name and reuse it as many times as needed in your code.
Variables behave as if they were the value they refer to. To use variables in your code, you first need to learn how to create them, which is pretty straightforward in Python.
Creating Variables With AssignmentsThe primary way to create a variable in Python is to assign it a value using the assignment operator and the following syntax:
Python Syntax variable_name = value Copied!In this syntax, you have the variable’s name on the left, then the assignment (=) operator, followed by the value you want to assign to the variable at hand. The value in this construct can be any Python object, including strings, numbers, lists, dictionaries, or even custom objects.
Note: To learn more about assignments, check out Python’s Assignment Operator: Write Robust Assignments.
Here are a few examples of variables:
Python >>> word = "Python" >>> number = 42 >>> coefficient = 2.87 >>> fruits = ["apple", "mango", "grape"] >>> ordinals = {1: "first", 2: "second", 3: "third"} >>> class SomeCustomClass: pass >>> instance = SomeCustomClass() Copied!In this code, you’ve defined several variables by assigning values to names. The first five examples include variables that refer to different built-in types. The last example shows that variables can also refer to custom objects like an instance of your SomeCustomClass class.
Setting and Changing a Variable’s Data TypeApart from a variable’s value, it’s also important to consider the data type of the value. When you think about a variable’s type, you’re considering whether the variable refers to a string, integer, floating-point number, list, tuple, dictionary, custom object, or another data type.
Python is a dynamically typed language, which means that variable types are determined and checked at runtime rather than during compilation. Because of this, you don’t need to specify a variable’s type when you’re creating the variable. Python will infer a variable’s type from the assigned object.
Note: In Python, variables themselves don’t have data types. Instead, the objects that variables reference have types.
For example, consider the following variables:
Python >>> name = "Jane Doe" >>> age = 19 >>> subjects = ["Math", "English", "Physics", "Chemistry"] >>> type(name) <class 'str'> >>> type(age) <class 'int'> >>> type(subjects) <class 'list'> Copied! Read the full article at https://realpython.com/python-variables/ »[ Improve Your Python With 🐍 Python Tricks 💌 – Get a short & sweet Python Trick delivered to your inbox every couple of days. >> Click here to learn more and see examples ]
Robin Wilson: Join the GeoTAM hackathon to work out business turnovers!
Summary: I’m involved in organising a hackathon, and I’d love you to take part. The open-source GeoTAM hackathon focuses on estimating turnover for individual business locations in the UK, from a variety of open datasets. Please checkout the hackathon page and sign up. There are prizes of up to £2,000!
(Click image for a larger version)
I’m currently working with Rebalance Earth, a boutique asset manager who are focused on making nature an investable asset. Our aim is to mobilise investment in UK natural infrastructure – for example, by arranging investment to undertake river restoration and reduce the risk of flooding. We will do this by finding businesses at risk of flooding, designing restoration schemes that will reduce this risk, and setting up ‘Nature-as-a-Service’ contracts with businesses to pay for the restoration.
I’m the Lead Geospatial Developer at Rebalance Earth, and am leading the development of our Geospatial Predictive Analytics Platform (GPAP), which helps us assess businesses at risk of flooding and design schemes to reduce this flooding.
An important part of deciding which areas to focus on is estimating the total business value at risk from flooding. A good way of establishing this is to use an estimate of the business turnover. However, there are no openly-available datasets showing business turnover in the UK – which is where the hackathon comes in.
We’re looking for participants to bring their expertise in programming, data science, machine learning and more to take some datasets we provide, combine them with other open data and try and estimate turnover. Specifically, we’re interested in turnover of individual business locations – for example, the turnover of a specific supermarket, not the whole supermarket chain.
The hackathon runs from 20th – 26th November 2024. We’ll provide some datasets, some ideas, and a Discord server to communicate through. We’d like you to bring your expertise and see what you can produce. This is a tricky task, and we’re not expecting fully polished solutions; proof-of-concept solutions are absolutely fine. You can enter as a team or an individual.
Most importantly, there are prizes:
- £2,000 for the First Prize
- £1,000 for the Second Prize
- £500 for the Third Prize
and there’s a possibility that we might even hire you to continue work on your idea!
So, please sign up and tell your friends!
Python Bytes: #408 python-preference only-managed 3.13t
Zato Blog: Meaningful automation in Python
This article is an introduction to meaningful automation, integrations and interoperability with Zato, service-oriented thinking and Python.
Zato is a convenient and secure, Python-based, open-source, service-oriented platform for automation, integrations and interoperability. It is used to connect distributed systems or data sources and to build API-focused, middleware and backend applications.
The platform is designed and built specifically with Python users in mind - often working in, and for, industries such as telecommunications, defense, health care and others that require automation, integrations and interoperability of multiple systems and processes.
Sample real-world, mission-critical Zato environments include:
-
Systems for telecommunication operators integrating CRM, ERP, Charging Systems, Billing and other OSS/BSS applications internal or external to the operators, including network automation of packet brokers and other network visibility and cybersecurity tools from Keysight
-
Enterprise services buses for government, helping in the digital transformation of legacy systems and processes towards modern capabilities
-
AI, ML and data science systems that analyze and improve acquisition and supply chain activities in government processes
-
Applied observability automation that enables meaningful decision making through the orchestration and coordination of the collection, distribution and presentation of data spread across a pool of independent systems
-
Platforms for health care and public administration systems, helping to achieve data interoperability through the integration of independent data sources, databases and health information exchanges (HIE)
-
Global IoT platforms for hybrid integrations of medical devices and software both in the cloud and on premises
-
Cybersecurity automation, including IT/OT hardware and software assets
-
Robotic process automation (RPA) of message flows and events produced by early warning systems
Zato offers connectors to all the popular technologies and vendors, such as REST, Cloud, task scheduling, Microsoft 365, Salesforce, Atlassian, SAP, Odoo, SQL, HL7, FHIR, AMQP, IBM MQ, LDAP, Redis, MongoDB, WebSockets, SOAP, Caching and many more.
Running in the cloud, on premises, or under Docker, Kubernetes and other container technologies, Zato services are optimized for high performance and security - it is easily possible to run hundreds and thousands of services on typical server instances as offered by Amazon, Google Cloud, Azure or other cloud providers.
Zato servers offer high availability and no-downtime deployment. Servers form clusters that are used to scale systems both horizontally and vertically.
The product is commercial open-source software with training, professional services and enterprise 24x7x365 support available.
A platform and language for interesting, reusable and atomic servicesZato promotes the design of, and helps you build, solutions composed of services that are interesting, reusable and atomic (IRA).
What does it really mean in practice that something is interesting, reusable and atomic? In particular, how do we define what is interesting?
Each interesting service should make its users want to keep using it more and more. People should immediately see the value of using the service in their processes. An interesting service strikes everyone as immediately useful in wider contexts, preferably with few or no conditions, prerequisites and obligations.
An interesting service is aesthetically pleasing, both in terms of its technical usage as well as its relevance to, and potential applicability in, fields broader than originally envisioned. If people check the service and say "I know, we will definitely use it" or "Why don't we use it" you know that the service is interesting. If they say "Oh no, not this one again" or "No, thanks, but no" then it is the opposite.
Note that focus here is on the value that the service brings for the user. You constantly need to keep in mind that people generally want to use services only if they allow them to fulfill their plans or execute some bigger ideas. Perhaps they already have them in mind and they are only looking for technical means of achieving that or perhaps it is your services that will make a person realize that something is possible at all, but the point is the same, your service should serve a grander purpose.
This mindset, of wanting to build things that are useful and interesting is not specific to Python or, indeed, to software and technology. Even if you are designing and implementing services for your own purposes, you need to act as if you were a consultant that can always see a bigger vision, a bigger architecture, and who can envision results that are still ahead in the future while at the same time not forgetting that it is always a series of small interesting actions, that everyone can relate to, that lead to success.
A curious observation can be made, particularly when you consider all the various aspects of the digital transformation that companies and organizations go through, is that many people to whom the services are addressed, or who sponsor their development, are surprised when they see what automation and integrations are capable.
Put differently, many people can only begin to visualize bigger designs once they see in practice smaller, practical results that further their missions, careers and otherwise help them at work. This is why, again, the focus on being interesting is essential.
At the same, it can be at times advantageous to you that people will not see automation or integrations coming. That lets you take the lead and build a center of such a fundamental shift around yourself. This is a great position to be in, a blue ocean of possibilities, because it means little to no competition inside an organization that you are a part of.
If you are your own audience, that is, if you build services for your own purposes, the same principles apply and it is easy to observe that thinking in services lets you build a toolbox of reusable, complementary capabilities, a portfolio, that you can take with you as you progress in your career. For instance, your services, and your work, can concentrate on a particular vendor and with a set of services that automate their products, you will be always able to put that into use, shorting your own development time, no matter who employs you and in what way.
Regardless of who the clients that you build the solutions for are, observe that automation and integrations with services are evolutionary and incremental in their nature, at least initially. Yes, the resulting value can often be revolutionary but you do not intend to incur any massive changes until there are clear, interesting results available. Trying to integrate and change existing systems at the same time is doable, but not trivial, and it is best left to later stages, once your automation gets the necessary buy-in from the organization.
Services should be ready to be used in different, independent processes. The processes can be strictly business ones, such as processing of orders or payments, or they can be of a deep, technical nature, e.g. automating cybersecurity hardware. What matters in either case is that reusability breeds both flexibility and stability.
There is inherent flexibility in being able to compose bigger processes out of smaller blocks with clearly defined boundaries, which can easily translate to increased competitive advantage when services are placed into more and more areas. A direct result of this is a reduction in R&D time as, over time, you are able to choose from a collection of loosely-coupled components, the services, that hide implementation details of a particular system or technology that they automate or integrate with.
Through their continued use in different processes, services can reduce overall implementation risks that are always part of any kind of software development - you will know that you can keep reusing stable functionality that has been already well tested and that is used elsewhere.
Because services are reusable, there is no need for gigantic, pure waterfall-style implementations of automation and integrations in an organization. Each individual project can contribute a smaller set of services that, as a whole, constitute the whole integrated environment. Conversely, each new project can start to reuse services delivered by the previous ones, hence allowing you to quickly, incrementally, prove the value of the investment in service-oriented thinking.
To make them reusable, services are designed in a way that hides their implementation details. Users only need to know how to invoke the service; the specific systems or processes it automates or integrates are not necessarily important for them to know as long as a specific business goal is achieved. Thanks to that, both services and what they integrate can be replaced without disrupting other parts - in reality, this is exactly what happens - systems with various kinds of data will be changed or modernized but the service will stay the same and the user will not notice anything.
Each service fulfills a single, atomic business need. Each service is deployed independently and, as a whole, they constitute an implementation of business processes taking place in your company or organization. Note that the definition of what the business need is, again, specific to your own needs. In purely market-oriented integrations, this may mean, for instance, the opening of a bank account. In IT or OT automation, on the other hand, it may mean the reconfiguration of a specific device.
That services are atomic also means that they are discrete and that their functionality is finely grained. You will recognize whether a design goes in this direction if consider the names of the services for a moment. An atomic service will invariably use a short name consisting of a single verb and noun. For instance, "Create Customer Account", "Stop Firewall", "Conduct Feasibility Study", it is easy to see that we cannot break them down into smaller part, they are atomic.
At the same time, you will keep creating composite services that invoke other services; this is natural and as expected but you will not consider services such as "Create Customer Account and Set Up a SIM Card" as atomic ones because, in that form, they will not be very reusable, and a major part of why being atomic is important is that it promotes reusability. For instance, having separate services to create customer accounts, independently of setting up their SIM cards, is that one can without difficulty foresee situations when an account is created but a SIM card is purchased at a later time and, conversely, surely one customer account should be able to potentially have multiple SIM cards. Think of it as being similar to LEGO bricks where just a few basic shapes can form millions of interesting combinations.
The point about service naming conventions is well worth remembering because this lets you maintain a vocabulary that is common to both technical and business people. A technical person will understand that such naming is akin to the CRUD convention from the web programming world while a business person will find it easy to map the meaning to a specific business function within a broader business process.
With Zato, you use Python to focus on the business logic exclusively and the platform takes care of scalability, availability communications protocols, messaging, security or routing. This lets you concentrate only on what is the very core of systems integrations - making sure their services are interesting, reusable and atomic.
Python is the perfect choice for this job because it hits the sweet spot under several key headings:
-
It is a very high level language, with a syntax close to how grammar of various spoken languages works, which makes it easy to translate business requirements into implementation
-
It is a solid, mainstream and full-featured, real programming language rather than a domain-specific one which means that it offers a great degree of flexibility and choice in expressing their needs
-
It is difficult to find universities without Python courses. Most people entering the workforce already know Python, it is a new career language. In fact, it is becoming more and more difficult to find new talent who would not prefer to use Python.
-
Yet, one does not need to be a developer or a full-time programmer to use Python. In fact, most people who use Python are not programmers at all. They are specialists in other fields who also need to use a programming language to automate or integrate their work in a meaningful way.
-
Many Python users come from backgrounds in network and cybersecurity engineering - fields that naturally require a lot of automation using a real language that is convenient and easy to get started with
-
Many Python users are scientists with a background in AI, ML and data science, applying their domain-specific knowledge in processes that, by their very nature, require them to collect and integrate data from independent sources, which again leads to automation and integrations
-
Many Python users have a strong web programming background which means that it takes little effort to take a step further, towards automation and integrations. In turn, this means that it is easy to find good people for API projects.
-
Many Python users know multiple programming languages - this is very useful in the context of integration projects where one is typically faced with dozens of technologies, vendors or integration methods and techniques.
-
Lower maintenance costs - thanks to the language's unique design, Python programmers tend to produce code that is easy to read and understand. From the perspective of multi-year maintenance, reading and analyzing code, rather than writing it, is what most programmers do most of the time, making sense to use a language that makes it easy to carry out the most common tasks.
In short, Python can be construed as executable pseudo-code with many of its users already having roots in modern server-side programming so Zato, both from a technical and strategic perspective, is a natural choice for both simple and complex, sophisticated automation, integration and interoperability solutions as a platform built in the language and designed for Python people from day one.
Next steps:➤ Read about how to use Python to build and integrate enterprise APIs that your tests will cover
➤ Python API integration tutorial
➤ Python Integration platform as a Service (iPaaS)
➤ What is an Enterprise Service Bus (ESB)? What is SOA?
James Bennett: Three Django wishes
Michael Foord: Python Knowledge Sharing Videos Online
I’ve been teaching Python in one hour knowledge sharing sessions, some of which I’ve put online on youtube.
This is the link to the playlist of the sessions:
The slides for each of the sessions, along with some example code, can be found in this github repository:
So far there are seven one-hour sessions (with more planned) on:
- Python Core Object Model
- Python objects
- Slots
- Attribute lookup and the MRO
- Inheritance, multiple inheritance and super
- Inside Python objects and classes
- Closures and decorators (functional programming)
- Functional programming: higher order functions and functions as objects
- Lambdas
- Closures: functions that build functions
- Variable scoping: global, local and nonlocal
- Decorators: functions wrapping functions
- Decorator factories (decorators that take arguments)
- Class decorators
- Decorator order and using functools.wraps
- Generators and Iterators
- The iteration protocol
- Stateful iteration with generators
- Adding iteration support to objects
- References, assignment and mutability
- Identity versus equality
- Call by object
- Object copying
- Unicode, Floats and regex
- Floating point numbers
- Unicode, encodings and strings
- Regular expressions
- Concurrency (async, threads, processes, the GIL)
- The history of concurrency from AmigaOS to a multi-core world
- Python and the Global Interpreter Lock
- I/O bound and CPU bound tasks
- Threads and processes
- Async programming (green threading, coroutines)
- Concurrency with threads
- Concurrency with multiprocessing
- Looking to the future (Python 3.13): optional GIL (PEP 703) and subinterpreters (PEP 554)
- Testing with pytest
- virtual environments and pipenv (installing pytest)
- pytest command line for collecting and running tests
- Simple test functions and asserts
- Test fixtures and conftest.py
- Testing exceptions
- Test parameterisation for test combinations
- Test marking for running test subsets
- Principles of testing (unit tests versus end to end testing, building test helpers etc)
- Mocking and patching
- Modules and Namespaces
- Import syntax variations
- namespaces and variable lookups
- sys.modules and the import cache
- Module objects
- Module level functionality: __dir__ and __getattr__
- Packages and the filesystem
- Relative import syntax
- Module reloading (how to do it and why not to do it)
- Circular imports, avoiding and fixing
- Executable modules and packages
A selection of some of the talks and interviews I’ve given on Python and software engineering across my career.
- UK Health Security Agency Software Development Practise Conf 2024
- PyCon UK 2023, Metaclasses in 5 Minutes Lightning Talk
- PyCon MEA 2022 How Python Took Over the World
- Test and Code Podcast Episode 145: For Those About to Mock
- PyCon Belarus 2020 How Python Took Over the World
- PyLondinium 2019 The Python Object Model
- Interview on Podcast.__init__ on testing, Mock and the Python community (2018)
- The Role of Abstractions: Lightning Talk PyCon US 2018
- Best Practises for Software Development and Testing (2017)
- PyCon UK Panel 2015
- To the Clouds: EuroPython 2015
- Automated Deployments with Juju: PyCon UK 2014
- Python and Pythons: PyCon NZ 2013
- Testing with Mock: PyCon US 2011
- A Little Bit of Python Podcast (2010-11)
- New and Improved unittest 2: PyCon US 2010
- Michael Foord on IronPython: Hanselminutes 2009
- Michael Foord on IronPython: TechEd 2007
Michael Foord: Agile Alliance Scrummaster Certification
I’ve been a fan of Agile ever since my first programming job with Resolver Systems back in 2006. I had taught myself programming and there I really learned engineering, how to build software products whilst caring about quality. I became passionate about testing as a way to ensure a minimal level of quality and about agile processes which are able to change quickly.
My only experience of Scrum was for a year at a heavily waterfall shop which layered Scrum for project management on top of heavily waterfall software development processes. It wasn’t a fun experience but I still learned a great deal.
I’ve been working with Gigaclear, as team lead on backend API servers, including One Touch Switch, for about a year now. I enjoy our software development practises and processes; we use a combination of agile for software development, devops (devsecops of course) for software deployment and maintenance, and Scrum for project management. It’s a very effective combination.
I recently attended a course with the Agile Alliance, led by John McFadyen, and became certified as a Scrummaster.
The course was fantastic and very inspiring. At Gigaclear we’re systematically evaluating all our systems, systems architecture and processes. This process and the course have been hugely inspirational and I have an article on software development processes coming shortly…
Glyph Lefkowitz: The Federation Deathmatch
It’s the weekend, and I have some Thoughts about federated social media. So, buckle up, I guess, it’s time to start some fights.
Recently there has been some discourse about Bluesky’s latest fundraising round. I’ve been participating in conversations about this on Mastodon, and I think I might sometimes come across as a Mastodon partisan, but my feelings are complex and I really don’t want to be boosting the ActivityPub Fediverse without qualification.
So here are some qualifications.
Bluesky Is EvilTo the extent that I am an ActivityPub partisan in the discourse between ActivityPub and ATProtocol, it is because I do not believe that Bluesky is a meaningfully decentralized social network. It is a social network, run by a company, which has a public API with some elements that might, one day, make it possible for it to be decentralized. But today, it is not, either practically or theoretically.
The Bluesky developers are putting in a ton of effort to maybe make it decentralized, hypothetically, someday. A lot of people think they will succeed. But ActivityPub (and, of course, Mastodon specifically) are already, today, meaningfully decentralized, as you can see on FediDB, there are instances with hundreds of thousands of people on them, before we even get to esoterica like the integrations Threads, Wordpress, Flipboard, and Ghost are doing.
The inciting incident for this post — that a lot of people are also angry about Bluesky raising millions of dollars from Evil Guys Doing Evil Stuff Capital — is indeed a serious concern. It lights the fuse that burns towards their eventual, inevitable incredible journey. ATProtocol is just an API, and that API will get shut off one day, whenever their funders get bored of the pretense of their network being “decentralized”.
At time of writing, it is also interesting that 3 of the 4 times that the CEO of Bluesky has even skeeted the word “blockchain” is to say “no blockchain”, to reassure users that the scam magnet of “Blockchain” is not actually near their product or protocol, which is a much harder position to maintain when your lead investor is “Blockchain Capital”.
I think these are all valid criticisms of Bluesky. But I also think that the actual engineers working on the product are aware of these issues, and are making a significant effort to address them or mitigate them in any way they can. All that work can still be easily incinerated by a slow quarter in terms of user growth numbers or a missed revenue forecast when the VCs are getting impatient, but it’s not nothing, it is a life’s work.
Really, who among us could not have our life’s ambitions trivially destroyed in an afternoon, simply because a billionaire decided that they should be? If you feel like you are safe from this, I have some bad news about how money works. So we are all doing our best in an imperfect system and maybe Bluesky is on to something here. That’s eminently possible. They’re certainly putting forth an earnest effort.
Mastodon Is StupidMeanwhile, not nearly as much has been made recently of Mastodon refusing funding from a variety of sources, when all indications are that funding is low, and plummeting, far below the level required to actually sustain the site, and they haven’t done a financial transparency report for over a year, and that report was already nearly a year late.
Mastodon and the fediverse are not nearly in a position to claim moral superiority over Bluesky. Sure, taking blockchain VC money might seem like a rookie mistake, but going out of business because you are spurning every possible source of funding is not that wise either.
Some might think that, sure, Mastodon the company might die but at least the Fediverse as a whole will keep going strong, right? Lots of people run their own instances! I even find elements of this argument convincing, and I think there is probably some truth to it. But to really believe this argument as claimed, that it’s a fait accompli that the fediverse will survive in some form, that all those self-run servers will be a robust network that will self-repair, requires believing some obviously false stuff. It is frankly unprofitable to run a Fediverse instance. Realistically, if you want to operate a mastodon server for yourself, it is going to cost at least $100/year once you include stuff like having a domain name, and managing the infrastructure costs is a complex problem that keeps getting harder to manage as the software itself gets slower.
Cory Doctorow has recently argued that this is all worth it, because at least on Mastodon, you’re in control, not at the whims of centralized website operators like Bluesky. In his words,
On Mastodon (and other services based on Activitypub), you can easily leave one server and go to another, and everyone you follow and everyone who follows you will move over to the new server. If the person who runs your server turns out to be imperfect in a way that you can’t endure, you can find another server, spend five minutes moving your account over, and you’re back up and running on the new server
He concludes:
Any system where users can leave without pain is a system whose owners have high switching costs and whose users have none
(Emphasis mine).
This is a beautiful vision. It is, however, an incorrect assessment of the state of the Fediverse as it stands today. It’s not true in two important ways:
First, if you look at any account of a user’s fediverse account migration, like this one from Steve Bate or this one from the Ente project or this one from Erin Kissane, you will see that it is “painful for the foreseeable future” or “wasn’t as seamless as advertised”, and that “the best time to […] migrate instances […] is never”. This language does not presage a pleasant experience, as Doctorow puts it, “without pain”.
Second, migration is an active process that requires engagement from the instance that hosts you. If you have been blocked or banned, or had your account terminated, you are just out of luck. You do not have control over your data or agency over your online identity unless you’ve shelled out the relatively exorbitant amount of money to actually operate your own instance.
In short, ActivityPub is no panacea. A federated system is not really a “decentralized” system, as much as it is a bunch of smaller centralized systems that all talk to each other. You still need to know, and care, about your social and financial relationship to the operators of your instance. There is probably no getting away from this, like, just generally on the Internet, no matter how much peer-to-peer software we deploy, but there certainly isn’t in the incomplete mess that is ActivityPub.
JOIN, or DIE.Neither Mastodon (or ActivityPub) nor Bluesky (or ATProtocol) has a comprehensive solution to the problem of decentralized social media. These companies, and these protocols, are both deeply flawed and if everything keeps bumping along as it is, I believe both are likely to fail. At different times, on different timelines, and for different reasons, but fail nonetheless.
However, these networks are both small and growing, and we are not yet in the phase of enshittification where margins are shrinking and audiences are captured and the screws must be tightened to juice revenue. There are stil possibilities. Mastodon is crowdfunded and what they lack in resources they make up for in flexibility and scrappiness. Bluesky has money and while there will eventually be a need to monetize somehow, they have plenty of runway to come up with that answer, and a lot of sophisticated protocol work has been done. Not enough to make a complete circut and allow users true, practical decentralization, but it’s not nothing, either.
Mastodon and Bluesky are both organizations with humans in them, and piles of data that is roughly schema-compatible even if the nuances and details are different. I know that there is a compatible model becuse thanks to both platforms being relatively open, there is a functioning ActivityPub/ATProtocol bridge in the form of Brid.gy Fed. You can use it today, and I highly recommend that you do so, so that “choice of protocol” does not fully define your audience. If you’re on bluesky, follow this account, and if you’re on Mastodon or elsewhere on the Fediverse, search for and follow @bsky.brid.gy@bsky.brid.gy.
The reality that fans of decentralized, independent social media must confront is that we are a tiny audicence right now. Whichever site we are looking at, we are talking about a few million monthly active users at best, in a world where even the pathetic husk of Twitter still has hundreds of millions and Facebook has billions. Interneceine fights are not going to get us anywhere. We need to build bridges and links and connect our networks as densely as possible. If I’m being honest, Bridgy Fed looks like a pretty janky solution, but it’s something, and we need to start doing something soon, so we do not collectively become a permanent minority that mass markets can safely ignore.
As users, we need to set an example, so that the developers of the respective platforms get their shit together and work together directly so that workarounds like Bridgy are not required. Frankly, this is mostly on the ActivityPub and Mastodon devs, as far as I can tell. Unfortunately, not a lot of this seems to be public, or at least I haven’t witnessed a lot of it directly, but I have heard repeatedly that the ActivityPub developers are prickly, and this is one high-profile public example where an ActivityPub partisan is incredibly, pointlessly hostile and borderline harrassing towards someone — Mike Masnick, a long-time staunch advocate for open protocols and open patents, someone with a Mastodon account, and thus as good a prospective ally as the ActivityPub fediverse might reasonably find — explaining some of the relative benefits of Bluesky.
Most of us are technology nerds in one way or another. In that way we can look at signifiers like “ActivityPub” and “ATProtocol”, and feel like these are hard boundaries around different all-encompassing structures for the future, and thus tribes we must join and support.
A better way to look at this, however, is to see social entities like Mastodon gGmbH and Bluesky PBC — or, more to the point, Fosstodon, SFBA Social, Hachyderm (and maybe, one day, even an instance which isn’t fully just for software development nerds), as groups that deploy these protocols to access some data that they publish, just as they might publish their website over HTTP or their newsletters over SMTP. There are technical challenges involved in bridging between mutually unintelligible domain models, but that is, like, network software's whole deal. Most software is just some kind of translation from one format or context to another. The best possible future for the fediverse is the one where users care as much about the distinction between ATProtocol and ActivityPub as they do about the distinction between POP3 and IMAP.
To both developers and users of these systems, I say: get it together. Be nice to each other. Because the rest of the social media ecosystem is sure as shit not going to be nice to us if we ever see even a hint of success and start to actually cut into their user base.
AcknowledgmentsThank you to my patrons who are supporting my writing on this blog. If you like what you’ve read here and you’d like to read more of it, or you’d like to support my various open-source endeavors, you can support my work as a sponsor!
Real Python: The Python Square Root Function
The Python square root function, sqrt(), is part of the math module and is used to calculate the square root of a given number. To use it, you import the math module and call math.sqrt() with a non-negative number as an argument. For example, math.sqrt(9) returns 3.0.
This function works with both integers and floats and is essential for mathematical operations like solving equations and calculating geometric properties. In this tutorial, you’ll learn how to effectively use the square root function in Python.
By the end of this tutorial, you’ll understand how:
- Python’s sqrt() function calculates square roots using Python’s math.sqrt() for quick and accurate results in your programs.
- math.sqrt() calculates the square root of positive numbers and zero but raises an error for negative inputs.
- Python’s square root function can be used to solve real-world problems like calculating distances using the Pythagorean theorem.
Time to dive in!
Python Pit Stop: This tutorial is a quick and practical way to find the info you need, so you’ll be back to your project in no time!
Free Bonus: Click here to get our free Python Cheat Sheet that shows you the basics of Python 3, like working with data types, dictionaries, lists, and Python functions.
Square Roots in MathematicsIn algebra, a square, x, is the result of a number, n, multiplied by itself: x = n²
You can calculate squares using Python:
Python >>> n = 5 >>> x = n**2 >>> x 25 Copied!The Python ** operator is used for calculating the power of a number. In this case, 5 squared, or 5 to the power of 2, is 25.
The square root, then, is the number n, which when multiplied by itself yields the square, x.
In this example, n, the square root of 25, is 5.
25 is an example of a perfect square. Perfect squares are the squares of integer values:
Python >>> 1**2 1 >>> 2**2 4 >>> 3**2 9 Copied!You might have memorized some of these perfect squares when you learned your multiplication tables in an elementary algebra class.
If you’re given a small perfect square, it may be straightforward enough to calculate or memorize its square root. But for most other squares, this calculation can get a bit more tedious. Often, an estimation is good enough when you don’t have a calculator.
Read the full article at https://realpython.com/python-square-root-function/ »[ Improve Your Python With 🐍 Python Tricks 💌 – Get a short & sweet Python Trick delivered to your inbox every couple of days. >> Click here to learn more and see examples ]
Michael Foord: Gigaclear One Touch Switch Service
For the last year I’ve been working as a team lead for backend API development with Gigaclear a UK rural ISP who own and run fibre internet to rural communities across the UK. This is alongside my training work.
This image shows the main project I’ve been working on since joining Gigaclear, One Touch Switch. A regulatory requirement for all ISPs to allow automated switching between ISPs. When you sign up with a new internet provider your account is automatically ceased with the old provider and VOIP numbers can be automatically ported.
Our OTS project is just part of the Gigaclear One Touch Switch system which interfaces with Salesforce and Netadmin and the website order flow (the Online Buying Journey) and represents an impressive engineering effort. We were one of the first ISPs with a system ready to take part in industry trials a few months ago, both OTS and our underlying systems passed pen testing with flying colours, and the switch on has been smooth.
Something I’m proud to have been part of. My current project is preparing security awareness training materials based on OWASP for our various engineering departments whilst we also undertake a systematic review of all of our systems and processes.
In the diagram I’m team lead for the Sphinx engineering team.
Michael Foord: Adventures with MicroPython
My first blog post in a few years! I have some articles I’d like to publish, and some adventures to share, so I thought it was time to fire up a blog engine again.
My nine year old son, Benjamin, is really into programming with Scratch and he’s keen to play with electronics and learn MicroPython. Which is awesome because there’s almost nothing I would love to do more with him.
MicroPython is an extremely impressive implementation of Python that will run on embedded devices and microcontrollers, as well as bigger tiny computers like the Raspberry Pi.
I’ve dug out an old MicroBit I had, purchased a Raspberry Pi Pico board/kit and also a ZumoBot 2040 robot which uses the same microcontroller as the Pico, to play with.
I’m now starting to get to grips with the basics, using the Thonny IDE.
I have a bunch of Neopixel LEDs, including a long light strip, I’d like to wire up in my living room controlled by a Pico board and an Android App using Kivy. That’s my goal number 1.
I’d like to program the ZumoBot to explore and map my flat. Goal 2.
Meanwhile Benjamin is enjoying playing with electronics (switches, LEDs, potentiometer and now a motor) with the Pico and on his own he’s programming the MicroBit with Scratch (or at least “blocks” which is the Microsoft equivalent). I’ve also done my first soldering in over a decade.
I have a github repository to track my tinkering, but I’d like to write up some recipes and post them on this blog as I go. (The biggest hurdle is I can’t easily create circuit diagrams. Time to explore.)
The github repository and ZumoBot links:
Brett Cannon: Don't return named tuples in new APIs
In my opinion, you should only introduce a named tuple to your code when you&aposre updating a preexisting API that was already returning a tuple or you are wrapping a tuple return value from another API.
Let&aposs start with when you should use named tuples. Usually an API that returns a tuple does so when you only have a couple of items in your tuple and the name of the function returning the tuple id enough to explain what each item in the tuple does. But sometimes your API expands and you find that your tuple is no longer self-documenting purely based on the name of the API (e.g., get_mouse_position() very likely has a two-item tuple of X and Y coordinates of the screen while app_state() could be a tuple of anything). When you find yourself in the situation of needing your return type to describe itself and a tuple isn&apost cutting it anymore, then that&aposs when you reach for a named tuple.
So why not start out that way? In a word: simplicity. Now, some of you might be saying to yourself, "but I use named tuples because they are so simple to define!" And that might be true for when you define your data structure (and I&aposll touch on this "simplicity of definition" angle later), but it actually makes your API more complex for both you and your users to use. For you, it doubles the data access API surface for your return type as you have to now support index-based and attribute-based data access forever (or until you choose to break your users and change your return type so it doesn&apost support both approaches). This leads to writing tests for both ways of accessing your data, not just one of them. And you shouldn&apost skimp on this because you don&apost know if your users will use indexes or attribute names to access the data structure, nor can you guarantee someone won&apost break your code in the future by dropping the named tuple and switching to some custom type (thanks to Python&aposs support of structural typing (aka duck typing), you can&apost assume people are using a type checker and thus the structure of your return type becomes your API contract). And so you need to test both ways of using your return type to exercise that contract you have with your users, which is more work than had you not used a named tuple and instead chose just a tuple or just a class.
Named tuples are also a bit more complex for users. If you&aposre reaching for a named tuple you&aposre essentially signalling upfront that the data structure is too big/complex for a tuple alone to work. And yet by using a named tuple means you are supporting the tuple approach even if you don&apost think it&aposs a good idea from the start. On top of that, the tuple API allows for things that you probably don&apost want people doing with your return type, like slicing, iterating over all the items as if they are homogeneous, etc. Basically my argument is the "flexibility" of having the index-based access to the data on top of the attribute-based access isn&apost flexible in a good way.
So why do people still reach for named tuples when defining return types for new APIs? I think it&aposs because people find them faster to define a new type than writing out a new class. Compare this:
Point = namedtuple(&aposPoint&apos, [&aposx&apos, &aposy&apos, z&apos])To this:
class Point: def __init__(self, x, y, z): self.x = x self.y = y self.z = zSo there is a clear difference in the amount of typing. But there are three more ways to do the same data structure that might not be so burdensome. One is dataclasses:
@dataclasses.dataclass class Point: x: int y: int z: intAnother is simply a dictionary, although I know some prefer attribute-based access to data so much that they won&apost use this option). Toss in a TypedDict and you also get editor support as well:
class Point(typing.TypedDict): x: int y: int z: int # Alternatively ... Point = typing.TypedDict("Point", {"x": int, "y": int, "z": int})A third option is types.SimpleNamespace if you really want attributes without defining a class:
Point = lambda x, y, z: types.SimpleNamespace(x=x, y=y, z=z)If none of these options work for you then you can always hope that somehow I convince enough people that my record/struct idea is a good one and get into the language. 😁
My key point in all of this is to prefer readability and ergonomics over brevity in your code. That means avoiding named tuples except where you are expanding to tweaking an existing API where the named tuple improves over the plain tuple that&aposs already being used.
Ned Batchelder: Coverage.py originally
Something many people don’t realize is that I didn’t write the original coverage.py. It was written by Gareth Rees in 2001. I’ve been extending and maintaining it since 2004. This ancient history came up this week, so I grabbed the 2001 version from archive.org to keep it here for posterity.
I already had a copy of Gareth’s original page about coverage.py, which now links to my local copy of coverage.py from 2001. BTW: that page is itself a historical artifact now, with the header from this site as it looked when I first copied the page.
The original coverage.py was a single file, so the “coverage.py” name was literal: it was the name of the file. It only had about 350 lines of code, including a few to deal with pre-2.0 Python! Some of those lines remain nearly unchanged to this day, but most of it has been heavily refactored and extended.
Coverage.py now has about 20k lines of Python in about 100 files. The project now has twice the amount of C code as the original file had Python. I guess in almost 20 years a lot can happen!
It’s interesting to see this code again, and to reflect on how far it’s come.
Hugo van Kemenade: Speed up CI with uv ⚡
We can use uv to make linting and testing on GitHub Actions around 1.5 times as fast.
LintingWhen using pre-commit for linting:
We can replace pre-commit/action with tox-dev/action-pre-commit-uv:
This means uv will create virtual environments and install packages for pre-commit, which is faster for the initial seed operation when there's no cache.
Lint comparisonFor example: python/blurb#32
Before After Times faster No cache 60s 37s 1.62 With cache 11s 11s 1.00 TestingWhen testing with tox:
We can replace tox with tox-uv:
tox-uv is tox plugin to replace virtualenv and pip with uv in your tox environments. We only need to install uv, and use uvx to both install tox-uv and run tox, for faster installs of tox, the virtual environment, and the dependencies within it.
Test comparisonFor example: python/blurb#32
Before After Times faster No cache 2m 0s 1m 26s 1.40 With cache 1m 58s 1m 22s 1.44 Bonus tipRun the new tool zizmor to find security issues in GitHub Actions.
Header photo: "Road cycling at the 1952 Helsinki Olympics" by Olympia-Kuva Oy & Helsinki City Museum, Public Domain.
Python Engineering at Microsoft: Python in Visual Studio Code – November 2024 Release
We’re excited to announce the November 2024 release of the Python, Pylance and Jupyter extensions for Visual Studio Code!
This release includes the following announcements:
- Generate docstrings with Pylance
- New fold and unfold all docstrings commands
- Import suggestions can now include aliases from user files
- Experimental AI Code Action for implementing abstract classes
- Native REPL variables view
If you’re interested, you can check the full list of improvements in our changelogs for the Python, Jupyter and Pylance extensions.
Generate docstrings with PylanceYou can now more conveniently generate documentation for your Python code with Pylance‘s docstrings template generation feature! You can generate a docstring template for classes or methods by typing """ or ''', pressing kbstyle(Ctrl+Space), or selecting the lightbulb to invoke the Generate Docstring Code Action. The generated docstring includes fields for the function’s description, parameter descriptions, parameter types, return value description, and return type.
This feature is currently behind an experimental setting, but we look forward to making it the default experience soon. You can try it out today by enabling the python.analysis.supportDocstringTemplate setting.
New fold and unfold all docstrings commandsDocstrings are great for providing context and explanations for your code, but sometimes you might want to fold them to focus on the code itself. You can now more easily do so by folding docstrings with the new Pylance: Fold All Docstrings command, which can also be bound to a keybinding of your choice. To unfold them, use the Pylance: Unfold All Docstrings command.
Import suggestions with aliases from user files
One of Pylance’s most powerful features is its ability to provide auto-import suggestions. By default, Pylance offers the import suggestion from where the symbol is defined, but you might want it to import from a file where the symbol is imported (i.e. aliased). With the new python.analysis.includeAliasesFromUserFiles setting, you can now control whether Pylance includes alias symbols from user files in its auto-import suggestions and in the add import Quick Fix.
Note: Enabling this setting can negatively impact performance, especially in large codebases, as Pylance may need to index more symbols and monitor more files for changes, which can increase resource usage.
Experimental AI Code Action: Implement Abstract ClassesYou can now get the best of both worlds with AI and static analysis with the new experimental Code Action to implement abstract classes! This feature requires both the Pylance and the GitHub Copilot extensions. To try it out, you can select the Implement all inherited abstract classes with Copilot Code Action when defining a class that inherits from an abstract one.
You can disable this feature by setting "python.analysis.aiCodeActions": {"implementAbstractClasses": false} in your User settings.
Native REPL Variables ViewThe Native Python REPL now provides up-to-date variables for the built-in Variables view. This lets you dig into the state of the interpreter as you execute code from files or through the REPL input box.
Upcoming deprecation of Python 3.8 support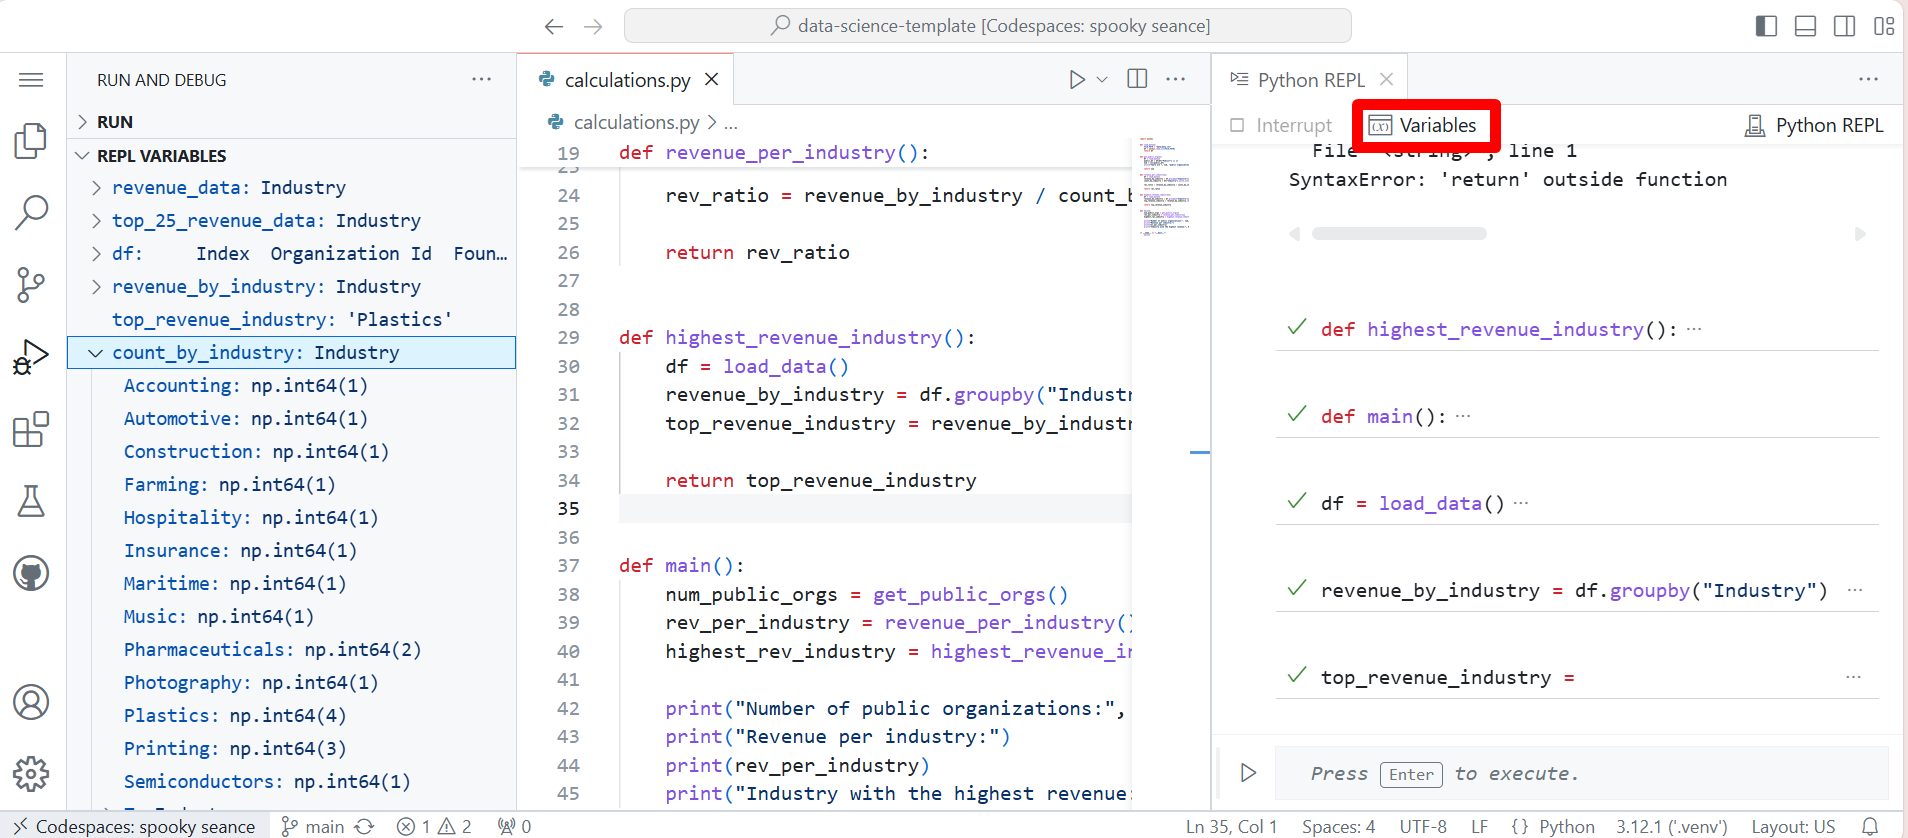
Python 3.8 reached end-of-life (EOL) on 2024-10-07. As such, official support for Python 3.8 in the Python extension will stop in three months, in the February 2025 release of the Python extension. There are no plans to actively remove support for Python 3.8, and so we expect the extension will continue to work unofficially with Python 3.8 for the foreseeable future.
Other Changes and EnhancementsWe have also added small enhancements and fixed issues requested by users that should improve your experience working with Python and Jupyter Notebooks in Visual Studio Code. Some notable changes include:
- There’s a new documentation page on the various ways to run Python code in VS Code.
- Pixi functionality has been restored only when Pixi is available (vscode-python#24310).
- You can now change the type checking mode to strict or standard from the Language Status menu (pylance-release#6080)
We would also like to extend special thanks to this month’s contributors:
- @mnoah1 Add customizable interpreter discovery timeout in vscode-python#24227
- @brokoli777 Refactor code to remove unused JSDoc types in vscode-python#24300
- @T-256 Make python_server.py compatible to Python 3.7 in vscode-python#24252
Note: This doesn’t guarantee full compatibility nor support for Python 3.7 in other parts of the Python extension. The minimum Python version we support is still Python 3.8 until February 2025, when the minimum officially supported version will be Python 3.9.
Try out these new improvements by downloading the Python extension and the Jupyter extension from the Marketplace, or install them directly from the extensions view in Visual Studio Code (Ctrl + Shift + X or ⌘ + ⇧ + X). You can learn more about Python support in Visual Studio Code in the documentation. If you run into any problems or have suggestions, please file an issue on the Python VS Code GitHub page.
The post Python in Visual Studio Code – November 2024 Release appeared first on Python.
Python Software Foundation: PyCon US 2025 Kicks Off: Website, CfP, and Sponsorship Now Open!
Exciting news: the PyCon US 2025 conference website, Call for Proposals, and sponsorship program are open!
To learn more about the location, deadlines, and other details, check out the links below:
- PyCon US 2025 Launch Blog Post
- PyCon US 2025 Website
- Submit Your PyCon US 2025 Proposal on Pretalx
- Sponsorship Application
- PyCon US 2025 Changes Blog Post
We’re very happy to answer any questions you have about PSF sponsorship or PyCon US 2025– please feel free to reach out to us at sponsors@python.org.
On behalf of the PSF and the PyCon US 2025 Team, we look forward to receiving your proposals and seeing you in Pittsburgh next year 🥳 🐍
PyCon: PyCon US 2025 Launches!
We’re super excited to announce that PyCon US 2025 is back in Pittsburgh! If you missed our first time here, please check out our PyCon US 2024 recap and video recordings.
We’re also excited to announce the launch of our conference website, along with Call for Proposals and our sponsorship program!We’re Coming Back to Pittsburgh!We will be hosting PyCon US 2025 again in Pittsburgh, Pennsylvania. We will continue to return in person, with Health and Safety Guidelines in place.PyCon US 2025 will be held at the David L. Lawrence Convention Center in Pittsburgh, Pennsylvania, on the following dates:
- May 14-15, 2025 - Tutorials
- May 15, 2025 - Sponsor Presentations
- May 16-18, 2025 - Main Conference Days—Keynotes, Talks, Charlas, Expo Hall, and more
- May 19-22, 2025 - Sprints
Introducing PyCon US Co-Chair, and Future Conference Chair: Jon Banafato!:"Hi folks! I'm Jon, and I've been a Python community organizer for the past decade and change. You may recognize me from my work behind the scenes at PyGotham, volunteering at other Python conferences, or talking shop with other community organizers. I'm excited to be working with Elaine and the rest of the staff, organizers, and volunteers for the next few PyCon US conferences. Feel free to reach out to share your thoughts about the conference, and I look forward to seeing everyone back in Pittsburgh next year!"PyCon US 2025 Website is Live
You can now head over to the PyCon US 2025 website for all the conference details and more information about our sponsorship program.
Our design for this year’s event draws inspiration from the local fare of Pittsburgh infused with pops of colors and dynamic elements that reflect the uniqueness and character of our community.
We’re excited to collaborate with designers Malek Jerbi and Hamza Haj Taieb from Tunisia, whose illustrations and designs brought the PyCon US 2025 website to life. The design is brought together with the coordination of Georgi K and implemented by YupGup.PyCon US Call for Proposals is Now OpenPyCon US 2025’s Call for Proposals is officially open for Talks, Tutorials, Posters, and Charlas! The deadline to submit for all tracks is December 19, 2024, 11:59 PM ET. You can view what time that is for you locally on our CfP countdown.
We need beginner, intermediate, and advanced proposals on all sorts of topics— and beginner, intermediate, and advanced speakers to give said presentations. You don’t need to be a 20-year veteran who has spoken at dozens of conferences. On all fronts, we need all types of people. Our community is comprised of a diverse set of people with unique skill sets, and we want our conference program to be a true reflection of that diversity.
For the new and first-time speakers, be sure to take advantage of the speaker mentorship program where you can be matched with experienced speakers who can help you with crafting your proposal. Check out the info on our Proposal Mentorship Program page.
For more information on where and how to submit your proposal, visit the Proposal Guidelines page on the PyCon US 2025 website.
Hatchery Program - Coming Soon!The PyCon US Hatchery is an effort to establish a path for the introduction of new tracks, summits, and demos at PyCon US. We are still finalizing the details of this program, so please stay tuned for more news about the PyCon US Hatchery 🐣 and start thinking of ideas you might want to contribute!
Sponsorship Has Tremendous ImpactSponsors are what make PyCon US and the Python Software Foundation possible. PyCon US is the main source of revenue for the PSF, the non-profit behind the Python language and the Python Packaging Index (PyPI), and the hub for the Python community.
PyCon US is the largest and longest-running Python gathering globally, with a diverse group of highly engaged attendees, many of whom you won’t find at other conferences. We’re excited to be able to provide our sponsors with opportunities to connect with and support the Python community. You’ll be face-to-face with talented developers, qualified recruits, and potential customers, access a large and diverse audience, as well as elevate your visibility and corporate identity within the Python community.
Check out our full menu of benefits,
What you can expect when you sponsor PyCon US and the PSF:
- Reach - Access to 2500+ attendees interested in your products and services and generate qualified leads.
- Brand strength - Be part of the biggest and most prestigious Python conference in the world and support the nonprofit organization behind the Python language.
- Connections - Networking with attendees in person to create connections and provide detailed information about your products and services.
- Recruiting - Access to qualified job candidates. If you’re hiring, there’s no better place to find Python developers than PyCon US.
- 12 months of benefits - Reach the Python community during PyCon US and beyond, with options for recognition on Python.org, PyPI.org, and more.
If you have any questions about sponsoring PyCon US and the PSF, please contact us at sponsors@python.org.Stay in the LoopAs we get closer to the event, the conference website is where you’ll find details for our call for proposals, registration launch, venue information, and everything PyCon US related! Be sure to subscribe here to the PyCon US Blog, follow @PyCon on Twitter, @pycon@fosstodon.org and @ThePSF@fosstodon.org on Mastodon, the PSF on LinkedIn, and subscribe to PyCon US 2025 News so you won’t miss a thing. Our official hashtag is #PyConUS.
Pages
Recent Publications
- Managing Hidden Dependencies in OO Software: a Study Based on Open Source Projects
- Open Source Communities as Liminal Ecosystems
- Investigating developers' email discussions during decision-making in Python language evolution
- Developers, Quality Control and Download Volume in Open Source Software (OSS) Projects
FLOSS Project Planets
FLOSS Research
- Improving Open Source security with the new GitHub Secure Open Source Fund
- Celebrating 5 years at the Open Source Initiative: a journey of growth, challenges, and community engagement
- Highlights from the Digital Public Goods Alliance Annual Members Meeting 2024
- Give Your Input on the State of Open Source Survey
- Open Data and Open Source AI: Charting a course to get more of both