
Feeds
Python Docs Editorial Board: Meeting Minutes: Nov 11, 2024
Dirk Eddelbuettel: inline 0.3.20: Mostly Maintenance
A new release of the inline package got to CRAN today marking the first release in three and half years. inline facilitates writing code in-line in simple string expressions or short files. The package was used quite extensively by Rcpp in the very early days before Rcpp Attributes arrived on the scene providing an even better alternative for its use cases. inline is still used by rstan and a number of other packages.
This release was tickled by changing in r-devel just this week, and the corresponding ‘please fix or else’ email I received this morning. R_NO_REMAP is now the default in r-devel, and while we had already converted most (old-style) calls into the API to using the now mandatory Rf_ prefix, the package contained few remaining cases in examples as well as one in code generation. The release also contains a helpful contributed PR making an error message a little clearer, plus several small and common maintenance changed around continuous integration, package layout and the repository.
The NEWS extract follows and details the changes some more.
Changes in inline version 0.3.20 (2024-11-10)Error message formatting is improved for compileCode (Alexis Derumigny in #25)
Switch to using Authors@R, other general packaging maintenance for continuous integration and repository
Use Rf_ in a handful of cases as R-devel now mandates it
Thanks to my CRANberries, you can also look at a diff to the previous release Questions, comments etc should go to the rcpp-devel mailing list off the R-Forge page. Bugs reports are welcome at the GitHub issue tracker as well (where one can also search among open or closed issues).
If you like this or other open-source work I do, you can sponsor me at GitHub.
This post by Dirk Eddelbuettel originated on his Thinking inside the box blog. Please report excessive re-aggregation in third-party for-profit settings.
Reproducible Builds: Reproducible Builds in October 2024
Welcome to the October 2024 report from the Reproducible Builds project.
Our reports attempt to outline what we’ve been up to over the past month, highlighting news items from elsewhere in tech where they are related. As ever, if you are interested in contributing to the project, please visit our Contribute page on our website.
Table of contents:
- Beyond bitwise equality for Reproducible Builds?
- ‘Two Ways to Trustworthy’ at SeaGL 2024
- Number of cores affected Android compiler output
- On our mailing list…
- diffoscope
- IzzyOnDroid passed 25% reproducible apps
- Distribution work
- Website updates
- Reproducibility testing framework
- Supply-chain security at Open Source Summit EU
- Upstream patches
Jens Dietrich, Tim White, of Victoria University of Wellington, New Zealand along with Behnaz Hassanshahi and Paddy Krishnan of Oracle Labs Australia published a paper entitled “Levels of Binary Equivalence for the Comparison of Binaries from Alternative Builds”:
The availability of multiple binaries built from the same sources creates new challenges and opportunities, and raises questions such as: “Does build A confirm the integrity of build B?” or “Can build A reveal a compromised build B?”. To answer such questions requires a notion of equivalence between binaries. We demonstrate that the obvious approach based on bitwise equality has significant shortcomings in practice, and that there is value in opting for alternative notions. We conceptualise this by introducing levels of equivalence, inspired by clone detection types.
A PDF of the paper is freely available.
On Friday 8th November, Vagrant Cascadian will present a talk entitled Two Ways to Trustworthy at SeaGL in Seattle, WA.
Founded in 2013, SeaGL is a free, grassroots technical summit dedicated to spreading awareness and knowledge about free source software, hardware and culture. Vagrant’s talk:
[…] delves into how two project[s] approaches fundamental security features through Reproducible Builds, Bootstrappable Builds, code auditability, etc. to improve trustworthiness, allowing independent verification; trustworthy projects require little to no trust.
Exploring the challenges that each project faces due to very different technical architectures, but also contextually relevant social structure, adoption patterns, and organizational history should provide a good backdrop to understand how different approaches to security might evolve, with real-world merits and downsides.
Fay Stegerman wrote that the cause of the Android toolchain bug from September’s report that she reported to the Android issue tracker has been found and the bug has been fixed.
the D8 Java to DEX compiler (part of the Android toolchain) eliminated a redundant field load if running the class’s static initialiser was known to be free of side effects, which ended up accidentally depending on the sharding of the input, which is dependent on the number of CPU cores used during the build.
To make it easier to understand the bug and the patch, Fay also made a small example to illustrate when and why the optimisation involved is valid.
On our mailing list this month:
-
Following-up to previous work, James Addison informed the list that the recently-released Sphinx documentation generator includes improvements to the next copyright notice substitutions.
-
Pol Dellaiera wrote to the list in order to seek advice around introducing the concept of reproducibility to computer science Masters students at the University of Mons, Belgium.
-
James Addison also followed-up to a previous thread on “CONFIG_MODULE_SIG and the unreproducible Linux Kernel” to add: “I wonder whether it would be possible to use the Linux kernel’s Integrity Policy Enforcement to deploy a policy that would prevent loading of anything except a set of expected kernel modules.” […]
-
There were also two informative replies from David Wheeler to a broad-based discussion on Reproducible Builds being defined in various standards. […][…]
diffoscope is our in-depth and content-aware diff utility that can locate and diagnose reproducibility issues. This month, Chris Lamb made the following changes, including preparing and uploading versions 279, 280, 281 and 282 to Debian:
- Ignore errors when listing .ar archives (#1085257). […]
- Don’t try and test with systemd-ukify in the Debian stable distribution. […]
- Drop Depends on the deprecated python3-pkg-resources (#1083362). […]
In addition, Jelle van der Waa added support for Unified Kernel Image (UKI) files. […][…][…] Furthermore, Vagrant Cascadian updated diffoscope in GNU Guix to version 282. […][…]
The IzzyOnDroid project has reached a good milestone by reaching over 25% of the ~1,200 Android apps provided by their repository (of official APKs built by the original application developers) having been confirmed to be reproducible by a rebuilder.
In Debian this month:
-
Holger Levsen uploaded devscripts version 2.24.2, including many changes to the debootsnap, debrebuild and reproducible-check scripts. This is the first time that debrebuild actually works (using sbuild’s unshare backend). As part of this, Holger also fixed an issue in the reproducible-check script where a typo in the code led to incorrect results […]
-
Recently, a news entry was added to snapshot.debian.org’s homepage, describing the recent changes that made the system stable again:
The new server has no problems keeping up with importing the full archives on every update, as each run finishes comfortably in time before it’s time to run again. [While] the new server is the one doing all the importing of updated archives, the HTTP interface is being served by both the new server and one of the VM’s at LeaseWeb.
The entry list a number of specific updates surrounding the API endpoints and rate limiting.
-
Lastly, 12 reviews of Debian packages were added, 3 were updated and 18 were removed this month adding to our knowledge about identified issues.
Elsewhere in distribution news, Zbigniew Jędrzejewski-Szmek performed another rebuild of Fedora 42 packages, with the headline result being that 91% of the packages are reproducible. Zbigniew also reported a reproducibility problem with QImage.
Finally, in openSUSE, Bernhard M. Wiedemann published another report for that distribution.
There were an enormous number of improvements made to our website this month, including:
-
Alba Herrerias:
-
Chris Lamb:
- Correct the name of Civil Infrastructure Platform name and update image on the Projects page. […]
- Update broken link on the Value Initialization page. […]
- Try and make pipeline/branch builds of the website easier to browse. […][…][…][…]
-
hulkoba
- Contribute to the new ‘Success stories’ page. […]
-
James Addison:
-
Ninette Adhikari:
-
Pol Dellaiera:
Lastly, Holger Levsen filed an extensive issue detailing a request to create an overview of recommendations and standards in relation to reproducible builds.
The Reproducible Builds project operates a comprehensive testing framework running primarily at tests.reproducible-builds.org in order to check packages and other artifacts for reproducibility. In October, a number of changes were made by Holger Levsen, including:
- Add a basic index.html for rebuilderd. […]
- Update the nginx.conf configuration file for rebuilderd. […]
- Document how to use a rescue system for Infomaniak’s OpenStack cloud. […]
- Update usage info for two particular nodes. […]
- Fix up a version skew check to fix the name of the riscv64 architecture. […]
- Update the rebuilderd-related TODO. […]
In addition, Mattia Rizzolo added a new IP address for the inos5 node […] and Vagrant Cascadian brought 4 virt nodes back online […].
The Open Source Summit EU took place recently, and covered plenty of topics related to supply-chain security, including:
- Public Sector & OpenSSF: Principles for Package Repository Security
- The Model Openness Framework: Promoting Completeness and Openness for Reproducibility, Transparency and Usability in AI
- Structured Scorecard Results: Tailor Your Own Supply-Chain Security Policies
- Lightning Talk: Elephant in the Room: How Supply Chain Security Standards Are Not Standard and What to Do About It
- Lightning Talk: Charting the Course for Secure Software Supply Chain with Guac-AI-Mole!
- TPMs, Merkle Trees and TEEs: Enhancing SLSA with Hardware-Assisted Build Environment Verification
- Accountability Taxonomy for AI Software Bill of Materials
- Securing Your Supply Chain with an Open Source Ecosystem
- OSS Supply Chain Threats and Why You Need a Holistic Security Strategy
- A Step Closer to in-Toto’lly Secure: Using in-Toto and OPA Gatekeeper to Verify Artifact Integrity
- Panel Discussion: Improving Supply Chain Integrity with OpenSSF Technologies
- Case Study: 10+ Years of Developing an SBOM System and the Dos and Don’ts
- SBOM in SaaS Environments: An Update
- Securing Git Repositories with Gittuf
The Reproducible Builds project detects, dissects and attempts to fix as many currently-unreproducible packages as possible. We endeavour to send all of our patches upstream where appropriate. This month, we wrote a large number of such patches, including:
-
Bernhard M. Wiedemann
- apache-ivy (.zip modification time)
- ccache (build failure)
- colord (CPU)
- efivar (CPU/march=native)
- gsl (no check)
- libcamera (date/copyright year)
- libreoffice (possible rpm/build toolchain corruption bug)
- moto (.gz modification time)
- openssl-1_1 (date-related issue)
- python-pygraphviz (benchmark)
- sphinx/python-pygraphviz (benchmark)
- python-panel (package.lock has random port)
- python-propcache (random temporary path)
- python314 (.gz-related modification time)
- rusty_v8 (random .o files)
- scapy (date)
- wine (parallelism)
- ibmtss (FTBFS-2026)
- pymol (date)
- pandas (ASLR)
- linutil (drop date)
- lsof (also filed in openSUSE: uname -r in LSOF_VSTR)
- schily (also filed in openSUSE: uname -r)
- superlu (nocheck)
- util (random test failure)
- ceph (year-2038 variation from embedded boost)
-
Chris Lamb:
-
James Addison:
- #1085112 filed against distro-info.
-
Zbigniew Jędrzejewski-Szmek:
Finally, If you are interested in contributing to the Reproducible Builds project, please visit our Contribute page on our website. However, you can get in touch with us via:
-
IRC: #reproducible-builds on irc.oftc.net.
-
Mastodon: @reproducible_builds@fosstodon.org
-
Mailing list: rb-general@lists.reproducible-builds.org
-
Twitter: @ReproBuilds
GNU Guix: Take the Guix User and Contributor Survey
To understand the views of the Guix community we're running a survey that we'd love you to take part in! The Guix User and Contributor Survey is live now, and should take about 10 minutes to fill out. Perfect for doing with a cup of tea and a biscuit!
The Guix project continues to grow and change, with new contributors and users joining our community. We decided to run this survey as it's the best way to gather good quality feedback across the widest cross-section of the community. Of course, there's lots of interesting topics a survey could ask about! We decided to focus on how Guix is used, and how contributors take part in the project.
The survey is being run on LimeSurvey which is a Free Software project and has been used by many other projects for similar surveys. The survey's hosted on the LimeSurvey SaaS so that we don't have the additional task of operating the software. No personal data is asked for (e.g. email addresses), no tracking data is being collected (e.g. IP addresses) and the entries are anonymised.
We'll be making the results and the anonymised data available under the Creative Commons CCO: that way anyone can analyse the data for further insights.
We hope the results of the survey will be used to understand both the Guix project's strengths and areas we can improve. Which is why your input is so important. If you can, please take the survey!
This Week in KDE Apps: Adopt an App
Welcome to a new issue of "This Week in KDE Apps"! Every week we cover as much as possible of what's happening in the world of KDE apps.
This week, we released KDE Gear 24.08.3 and we are preparing the 24.12.0 release with the beta planned for next week. The final release will happen on December 12th, but, meanwhile, and as part of the 2024 end-of-year fundraiser, you can "Adopt an App" in a symbolic effort to support your favorite KDE app.
This week, we are particularly grateful to @petejones@hcommons.social, @DaisyLee@mastodon.social and Karcsesz for showing their support for Tokodon; manchicken for Merkuro and fat_malama, Alexandru Traistaru and Neeko iko for KDE Connect.
Any monetary contribution, however small, will help us cover operational costs, salaries, travel expenses for contributors and in general just keep KDE bringing Free Software to the world. So consider donating today!
Getting back to all that's new in the KDE App scene, let's dig in!
Alligator Feed reader for mobile devicesThe user can no longer open the feed details page multiple times (Soumyadeep Ghosh, 24.12.0, link).
Falkon Web BrowserIt is now possible to open a context menu with Greasemonkey (Juraj Oravec, 24.12.0, link). Greasemonkey you to run little scripts that make on-the-fly changes to web page content. Juraj also removed the advertised FTP support in Falkon as the support for FTP was removed from Chromium. (Juraj Oravec, 24.12.0, link)
Dolphin Manage your filesWe no longer ask password twice when entering the Dolphin's admin mode (kio-admin) (Felix Ernst, 24.12.0, link).
Felix also improved the keyboard navigation in the toolbar, now the elements are focused in the right order (Felix Ernst, 24.12.0. link 1 and link 2).
KDE Itinerary Digital travel assistantItinerary can now show you a map of the whole trip (Volker Krause, 24.12.0, link).
And display some statistics about your trip, for example the CO2 emission, the distance travelled and the costs (if available) (Volker Krause, 24.12.0, link).
Finally, the alignment of timeline elements in Itinerary is now much more consistent (Carl Schwan, 24.12.0, link).
Okular View and annotate documentsWhen loading PDF files with Ink annotation containing an empty path, Okular won't crash. You shouldn't be able to create such annotations with Okular anyway, but some PDF files out there do contains such annotations (Albert Astals Cid, 24.12.0, link).
We also no longer hide the signing UI prematurely and now ensure it is visible until the signing process is actually finished (Nicolas Fella, 24.12.0, link).
Finally we fixed a small memory leak in Okular's latex support (Nil Admirari, 24.12.0, link).
Kaffeine Multimedia PlayerKaffeine got ported to Qt6/KF6 (Tobias Klausmann, 24.12.0, link).
Calculator A feature rich calculatorKalk will now correctly handle pressing the Esc key and clear the input field like many other calculator applications do, instead of creating strange characters in the input area (Devin Lin, 24.12.0, link).
Kasts Podcast applicationBart de Vries fixed password loading for synchronisation services on Windows (Bart De Vries, 24.12.0 link).
Kate Advanced Text EditorThe performance of displaying the build output has been improved (Waqar Ahmed, 24.12.0 link).
KDevelop Featureful, plugin-extensible IDE for C/C++ and other programming languagesWe addressed certain annoyances when working with the flatpak runtime. This included, for example, improving the handling of .flatpak-manifest.json files which we use in KDE for storing the an application's Flatpak manifest (Aleix Pol Gonzalez, 24.12.0 link).
KMail A feature-rich email applicationKMail and other PIM applications can now be compiled on Windows (Ingo Klöcker and Laurent Montel link 1 and link 2). Having KDE PIM applications work well on Windows is still in early stages of development. There is still a lot of work required to make Kontact a good experienceon that platform.
KMix Sound MixerKMix got ported to Qt6/KF6 (Jonathan Marten, 24.12.0 link).
Krita Digital Painting, Creative FreedomSVGs with clip masks now render faster (Dmitry Kazakov, link).
Konsole Use the command line interfaceKonsole now always creates a cgroup hierarchy when creating new process. This prevents entire applications getting killed in an Out-Of-Memory (OOM) scenarios when a tab consumes too much RAM (David Redondo, 24.12.0, link). David also ensured the subprocess of Konsole are correctly mapped to Konsole's .desktop file (link).
Kwave Sound editorKWave now provides a better visual indication when playback is paused (Mark Penner, 24.12.0, link).
NeoChat Chat on MatrixWe improved the network proxy's config page look to make it more consistent with the other config pages (Joshua Goins, 24.12.0, link).
Joshua Goins and Olivier Beard improved the link preview. Now clicking anywhere on the link preview will take you to the linked webpage (Joshua Goins, 24.12.0, link). The separator shown to the left of the preview and quoted text also got stylish rounded corners (Olivier Beard, 24.12.0, link).
NeoChat now hides non-standard rooms from the room list as most of the time they are used exclusively for holding data (e.g. trip group information from Itinerary) and not meant to be interacted with (Joshua Goins, 24.12.0, link).
We also improved the way polls look (Carl Schwan, 24.12.0, link).
And made sending messages and inserting newline shortcuts configurable (Eren Karakas, 24.12.0, link).
Tokodon Browse the FediverseRight clicking on a link on a post will now show a context menu allowing users to copy or share the URL directly (Arran Ubels, 24.12.0, link).
And all this too...The layout of the About dialog of applications using QtWidgets has been improved (Carl Schwan, KDE Frameworks 6.10.0, link).
Before After ... And Everything ElseThis blog only covers the tip of the iceberg! If you’re hungry for more, check out Nate's blog about Plasma and be sure not to miss his This Week in Plasma series, where every Saturday he covers all the work being put into KDE's Plasma desktop environment.
For a complete overview of what's going on, visit KDE's Planet, where you can find all KDE news unfiltered directly from our contributors.
Get InvolvedThe KDE organization has become important in the world, and your time and contributions have helped us get there. As we grow, we're going to need your support for KDE to become sustainable.
You can help KDE by becoming an active community member and getting involved. Each contributor makes a huge difference in KDE — you are not a number or a cog in a machine! You don’t have to be a programmer either. There are many things you can do: you can help hunt and confirm bugs, even maybe solve them; contribute designs for wallpapers, web pages, icons and app interfaces; translate messages and menu items into your own language; promote KDE in your local community; and a ton more things.
You can also help us by donating. Any monetary contribution, however small, will help us cover operational costs, salaries, travel expenses for contributors and in general just keep KDE bringing Free Software to the world.
To get your application mentioned here, please ping us in invent or in Matrix.
Thorsten Alteholz: My Debian Activities in October 2024
This month I accepted 398 and rejected 22 packages. The overall number of packages that got accepted was 441.
In case your RM bug is not closed within a month, you can assume that either the conversion of the subject of the bug email to the corresponding dak command did not work or you still need to take care of reverse dependencies. The dak command related to your removal bug can be found here.
Unfortunately the bahavior of some project members caused a decline of motivation of team members to work on these bugs. When I look at these bugs, I just copy and paste the above mentioned dak commands. If they don’t work, I don’t have the time to debug what is going wrong. So please read the docs and take care of it yourself. Please also keep in mind that you need to close the bug or set a moreinfo tag if you don’t want anybody to act on your removal bug.
Debian LTSThis was my hundred-twenty-fourth month that I did some work for the Debian LTS initiative, started by Raphael Hertzog at Freexian. During my allocated time I uploaded or worked on:
- [DLA 3925-1] asterisk security update to fix two CVEs related to privilege escalation and DoS
- [DLA 3940-1] xorg-server update to fix one CVE related to privilege escalation
Last but not least I did a week of FD this month and attended the monthly LTS/ELTS meeting.
Debian ELTSThis month was the seventy-fifth ELTS month. During my allocated time I uploaded or worked on:
- [ELA-1198-1]cups security update for one CVE in Buster to fix the IPP attribute related CVEs.
- [ELA-1199-1]cups security update for two CVEs in Stretch to fix the IPP attribute related CVEs
- [ELA-1216-1]graphicsmagick security update for one CVE in Jessie
- [ELA-1217-1]asterisk security update for two CVEs in Buster related to privilege escalation
- [ELA-1218-1]asterisk security update for two CVEs in Stretch related to privilege escalation and DoS
- [ELA-1223-1]xorg-server security update for one CVE in Jessie, Stretch and Buster related to privilege escalation
I also did a week of FD and attended the monthly LTS/ELTS meeting.
Debian PrintingUnfortunately I didn’t found any time to work on this topic.
Debian MatomoUnfortunately I didn’t found any time to work on this topic.
Debian AstroUnfortunately I didn’t found any time to work on this topic.
Debian IoTThis month I uploaded new upstream or bugfix versions of:
- … pywws (yes, again this month)
This month I uploaded new packages or new upstream or bugfix versions of:
- … osmocom-dahdi-linux (package prepared by Nathan)
- … osmo-bts
This month I uploaded new upstream or bugfix versions of:
New Video by Ramon Miranda: Seamless Templates
We've released a new video! ..Templates! you can create them with Krita to save time in your digital paintings and be more focused on your artwork. They are seamless, they are useful, and they are really easy to generate. So let´s go with another supercool feature of Krita.
Check out the video for download links for the templates themselves!
Jonathan Dowland: Progressively enhancing CGI apps with htmx
I was interested in learning about htmx, so I used it to improve the experience of posting comments on my blog.
It seems much of modern web development is structured around having a JavaScript program on the front-end (browser) which exchanges data encoded in JSON asynchronously with the back-end servers. htmx uses a novel (or throwback) approach: it asynchronously fetches snippets of HTML from the back-end, and splices the results into the live page. For example, a htmx-powered button may request a URI on the server, receive HTML in response, and then the button itself would be replaced by the resulting HTML, within the page.
I experimented with incorporating it into an existing, old-school CGI web app: IkiWiki, which I became a co-maintainer of this year, and powers my blog. Throughout this project I referred to the excellent book Server-Driven Web Apps with htmx.
Comment posting workflowI really value blog comments, but the UX for posting them on my blog was a bit clunky. It went like this:
you load a given page (such as this blog post), which is a static HTML document. There's a link to add a comment to the page.
The link loads a new page which is generated dynamically and served back to you via CGI. This contains a HTML form for you to write your comment.
The form submits to the server via HTTP POST. IkiWiki validates the form content. Various static pages (in particular the one you started on, in Step 1) are regenerated.
the server response to the request in (3) is a HTTP 302 redirect, instructing the browser to go back to the page in Step 1.
First, I wanted the "add a comment" link to present the edit box in the current page. This step was easiest: add four attributes to the "comment on this page" anchor tag:
- hx-get="<CGI ENDPOINT GOES HERE>"
- suppresses the normal behaviour of the tag, so clicking on it doesn't load a new page.
issues an asynchronous HTTP GET to the CGI end-point, which returns the full HTML document for the comment edit form
- hx-select=".editcomment form"
- extract the edit-comment form from within that document
- hx-swap=beforeend and hx-target=".addcomment"
- append (courtesy of beforeend) the form into the source page after the "add comment" anchor tag (.addcomment)
Now, clicking "comment on this page" loads in the edit-comment box below it without moving you away from the source page. All that without writing any new code!
Second step: handling previews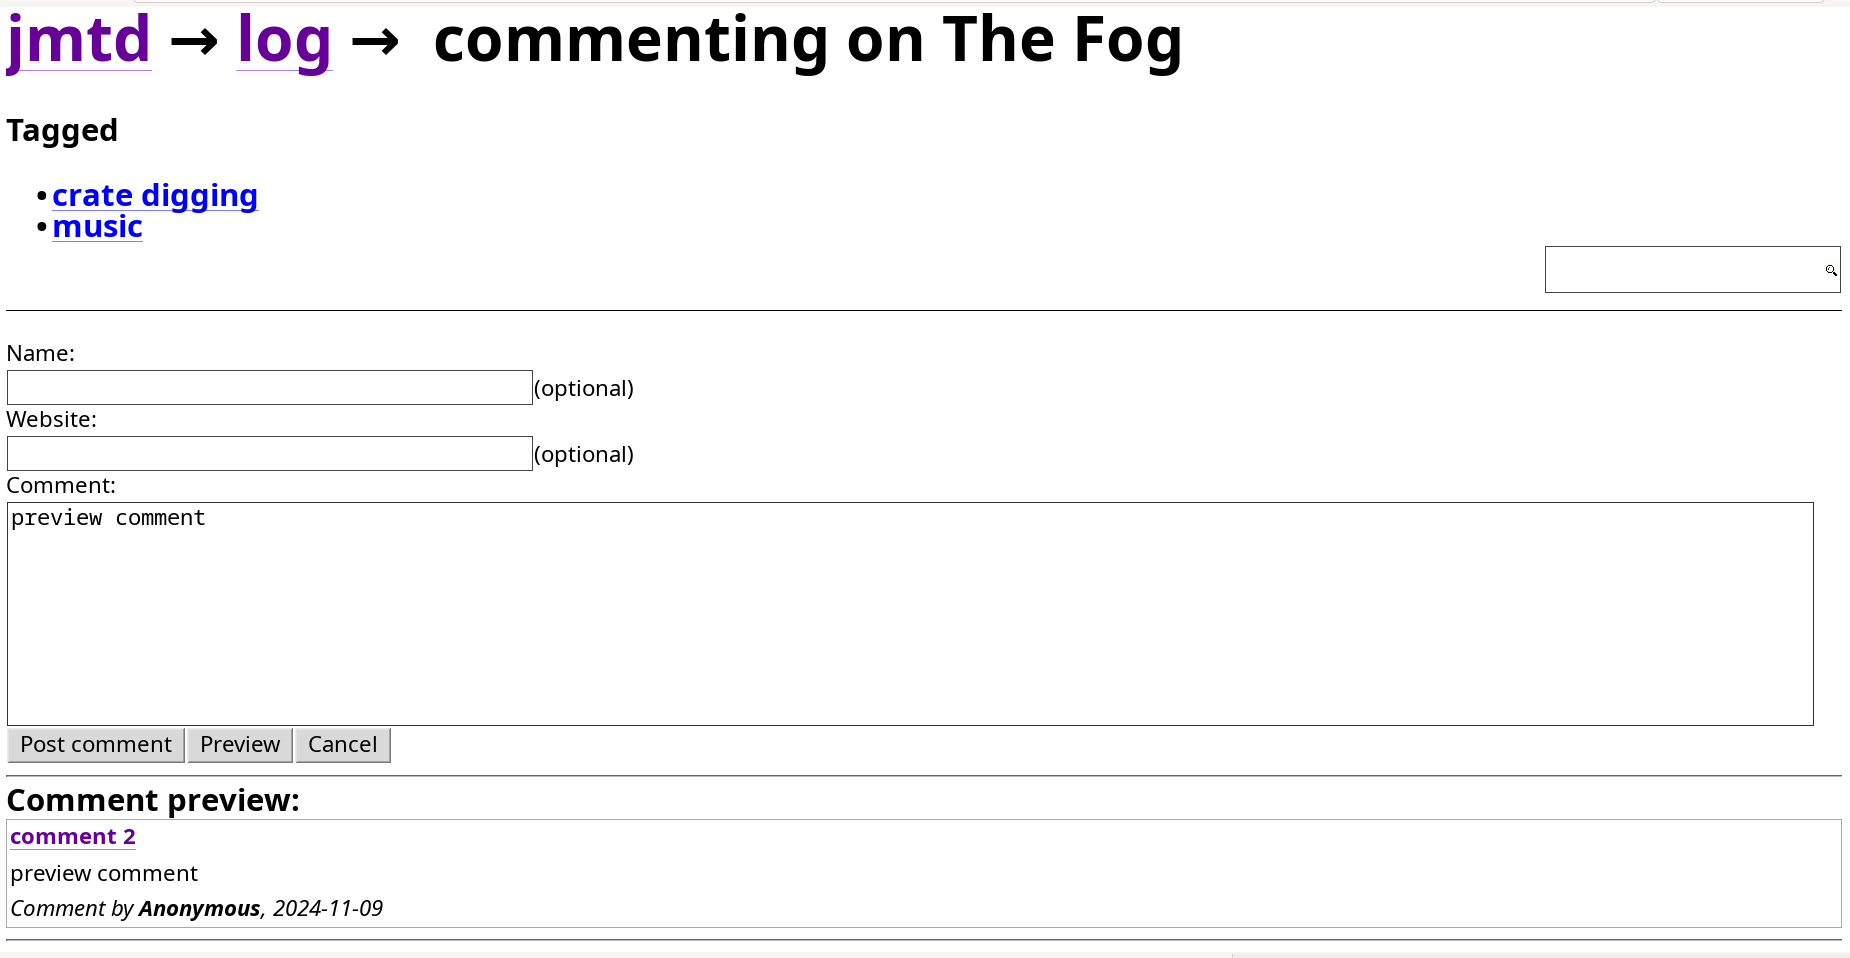
The old Preview Comment page
In the traditional workflow, clicking on "Preview" loaded a new page containing the edit form (but not the original page or any existing comments) with a rendering of the comment-in-progress below it. I wasn't originally interested in supporting the "Preview" feature, but I needed to for reasons I'll explain later.
Rather than load new pages, I wanted "Preview" to insert a rendering of the comment-in-progress being inserted into the current page's list of comments, marked up to indicate that it's a preview.
IkiWiki provides some templates which you can override to customise your site. I've long overridden page.tmpl, the template used for all pages. I needed to add a new empty div tag in order to have a "hook" to target with the previewed comment.
The rest of this was achieved with htmx attributes on the "Preview" button, similar to in the last step: hx-post to define a target URI when you click the button (and specify HTTP POST); hx-select to filter the resulting HTML and extract the comment; hx-target to specify where to insert it.
Now, clicking "Preview" does not leave the current page, but fetches a rendering of your comment-in-progress, and splices it into the comment list, appropriately marked up to be clear it's a preview.
Third step: handling submitted commentsIkiWiki is highly configurable, and many different things could happen once you post a comment.
On my personal blog, all comments are held for moderation before they are published. The page you were served after submitting a comment was rather bare-bones, a status message "Your comment will be posted after moderator review", without the original page content or comments.
I wanted your comment to appear in the page immediately, albeit marked up to indicate it was awaiting review. Since the traditional workflow didn't render or present your comment to you, I had to cheat.
handling moderated comments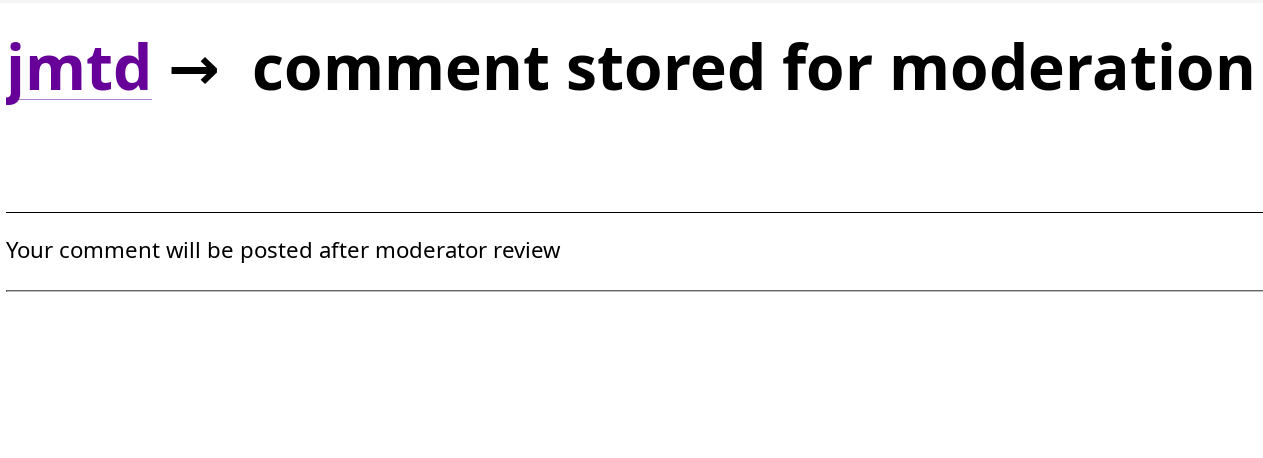
Moderation message upon submitting a comment
One of my goals with this project was not to modify IkiWiki itself. I had to break this rule for moderated comments. When returning the "comment is moderated" page, IkiWiki uses HTTP status code 200, the same as for other scenarios. I wrote a tiny patch to return HTTP 202 (Accepted, but not processed) instead.
I now have to write some actual JavaScript. htmx emits the htmx:beforeSwap event after an AJAX call returns, but before the corresponding swap is performed. I wrote a function that is triggered on this event, filters for HTTP 202 responses, triggers the "Preview" button, and then alters the result to indicate a moderated, rather than previewed, comment. (That's why I bothered to implement previews). You can read the full function here: jon.js.
SummaryI've done barely any front-end web development for years and I found working with htmx to be an enjoyable experience.
You can leave a comment on this very blog post if you want to see it in action. I couldn't resist adding an easter egg: Brownie points if you can figure out what it is.
Adding htmx to an existing CGI-based website let me improve one of the workflows in a gracefully-degrading way (without JavaScript, the old method will continue to work fine) without modifying the existing application itself (well, almost) and without having to write very much code of my own at all: nearly all of the configuration was declarative.
September and October in KDE PIM
Here's our bi-monthly update from KDE's personal information management applications team. This report covers progress made in September and October 2024.
Since the last report, 24 people have contributed over 1100 changes to the KDE PIM code base. We also released a two bugfix releases of the KDE PIM Suite with the Gear releases 24.08.1 and 24.08.2
Please note this is the last bi-monthly blog post for KDE PIM. We will continue to work on KDE PIM but weekly improvements to KDE PIM are now included in the This Week in KDE Apps blog.
AkademyThe KDE PIM team was at Akademy from the 7th to the 12th of September in Würzburg (Germany). We hosted again a PIM BoF.
We covered a few topics and made plans. In particular we touched upon contributions blockers, we hope the milestone system will help and also working on the amount of repositories which are not part of KDE Frameworks. Things are progressing in the right direction but slowly. Feel free to reach out to help!
MilestonesTalking about the milestones. You can see what we got in store on the Gitlab board. Some of them are progressing nicely like the resurrection of Kontact for Windows or the port away from QCA.
If you see anything you fancy and you would like to help, reach out to us on the #kontact:kde.org Matrix channel!
Applications ItineraryOur travel assistance app Itinerary got a new two-level trip/timeline view, an extended public transport location search, a new full trip map view and better Android platform integration. Read more in [its own bi-monthly update] (https://volkerkrause.eu/2024/10/03/kde-itinerary-august-september-2024.html).
KAlarmDavid has been working on fixing bugs around sound handling. In particular, repeating audio alarms only playing once have been fixed. Likewise the failure to play sound files using libVLC on some systems is gone. Also the backend to play sound can be changed at build time, it can use VLC or MPV.
But that's not the only bugs which got squashed. It's now possible to wake from suspend when using RTC wake and a crash has been fixed affecting systems where the kernel supports alarm timers.
Last but not least, the GUI has been improved around the run mode options in the preferences dialog.
MerkuroClaudio has been busy fixing regressions and improving the stability of Merkuro. Notably, maps are now displayed again (if the event contains coordinates). Also, the collection combobox in the editors are now initialized with a valid collection and filtering features have been repaired.
KAddressBook and KOrganizerThe general improvements to support Plasma Activities is still on going. It is not enabled by default as it requires Akonadi Resources support to become really useful and the corresponding changes are not there yet.
KMailOn the KMail front the search has been greatly improved. There is now a custom syntax usable in the search text field. One can now use keywords like subject:, body:, to, from, has:attachment, is:important, is:replied and so on to make more precise queries.
For instance one could write "from:vkrause@kde.org to:kde-pim@kde.org is:important" to get only the emails from Volker on the kde-pim mailing list which are also flagged as important.
Fedora KDE Enabling Third Party Repositories
As you may know, Fedora KDE 41 was released a couple of weeks ago.
I wanted to talk about a special feature that our colleague @farchord (with support from upstream developer @Nate Graham) has brought to our Fedora KDE distribution:
Enabling Third Party Repositories With A Single Click!
Thanks to the flexibility of plasma-welcome we can offer this feature
Right after installing Fedora and on first login you will be presented with the Plasma Welcome window:
Before you click on Skip , you can go through the different slides to read about KDE and Fedora and also to decide whether you want to contribute with anonymous metrics or not (note: I personally do not):
Here is where the interesting part comes in, on the next slide:
With a simple click of a button you will enable the most commonly requested by our users Third Party Repositories like rpmfusion! (note: you will be asked for your administrator password)
Once the request is processed, the message will change to:
That’s it! You have successfully enabled Third Party Repositories without needing to modify any file or running any command whatsoever
Before you do anything with your system and your new configuration, I will strongly recommend to update your system via Plasma Discover :
Proceed with all the update and reboot to get the latest and shiniest from our repositories.
Finally, to verify that the Third Party software is available, you can check:
And that is it!
Enjoy!
This is all thanks to farchord, siosm , aleasto and ngraham‘s work!
Ubuntu Summit 2024: A joyful experience filled with sorrow
Has this ever occurred to you? The most joyful moments of your life got filled with sorrow, a grief of loss…
Let’s talk about the Ubuntu Summit first, my international conference and solo travel outside my country. Probably I am the first from my entire extended family to visit a European country. My parents, well-wishers everyone was so happy. Only person didn’t know much about this, my maternal grandfather, whom I called (yes, “called”, he left us on 27th October 2024) Dada. Let me tell you about the summit first.
This Week in Plasma: Everything You Wanted and More
This week was full of major feature work and UI polishing, in addition to a lot of bug-fixing! I'm pretty sure everyone will find something to be excited about here:
Notable New FeaturesYou can now swap the functions of drawing tablet pen buttons if you like the function performed by one of the buttons, but not which button activates it. (Joshua Goins, 6.3.0. Link)
Info Center now shows all of your GPUs, not just one of them. And they are now indicated in a fancy way! (Harald Sitter, 6.3.0. Link 1 and link 2)
Discover now shows you when apps are either packaged directly by their developer, or verified by a trusted third party. (Aleix Pol Gonzalez, 6.3.0. Link)
The Printers widget now shows each printer's print queue inline, right there in the widget! (Kai Uwe Broulik, 6.3.0. Link)
The Task Manager widget now lets you configure whether the "I'm playing audio" icons that appear in the corner of tasks can be clicked to mute the audio. In addition, the audio controls now always appear in the window preview thumbnails, and can't be accidentally disabled. (Petar Margetic, 6.3.0. Link)
When you've set up your system to reboot into the bootloader menu the next time it reboots (and not the firmware screen; that case was already handled), the logout screen how indicates this. (Nikolay Kochulin, 6.3.0. Link)
Notable UI ImprovementsWhen you put a pie chart style System Monitor widget on a really skinny panel, the percentage circle in the center now looks nice, rather than being jagged and overly bold. (Arjen Hiemstra, 6.2.4. Link)
Made the progress indicators on Discover's Updates page more readable. (Nate Graham, 6.2.4. Link)
The Keyboard Indicator widget now indicates when modifier keys are "latched" or "locked", as they can be when using certain accessibility settings. (Nicolas Fella, 6.3.0. Link)
Removed the "Settings" launcher menu category! Now all of its contents have been moved into the "System" category. This reduces the number of categories that don't offer meaningful grouping. (Nate Graham, 6.3.0. Link)
The Printers widget now shows a little busy spinner for any printers that are currently printing, to make them easier to pick out among others when there are a lot of printers available. (Kai Uwe Broulik. 6.3.0. Link)
Widgets placed on the desktop are now very slightly translucent, just like the popups of widgets placed on the panel. (Marco Martin, 6.3.0. Link)
When for some reason the system time zone is set incorrectly or not set at all, the Digital Clock widget now tells you what's going on and offers you the chance to fix it yourself instead of just being broken. (Niccolò Venerandi, 6.3.0. Link)
Added a distinct Breeze icon for System Settings' Shortcuts page. (Joshua Goins, Frameworks 6.9. Link)
Improved the Breeze icon shown on password dialogs. (Kai Uwe Broulik, Frameworks 6.9. Link)
Notable Bug FixesFixed a case where KWin would crash when plugging in external screens. (Xaver Hugl, 6.2.3. Link)
Fixed a regression caused by a version 0.22 of the power-profiles-daemon service that caused power profiles to not be registered properly by Plasma's Power and Battery widget until you manually restarted the Powerdevil service. (Méven Car, 6.2.3. Link)
Discover's auto-update feature once again works for Flatpak apps. (Harald Sitter, 6.2.4. Link)
The speaker test window on System Settings' Audio page now always fits its content, no matter what the name of the device or its audio profile may be. (Ismael Asensio, 6.2.4. Link)
Fixed a strange issue that would make GTK 4 apps look too dark when using HDR mode. Now they're a bit too light, but this is a GTK 4 bug. (Xaver Hugl, 6.2.4. Link)
Plasma panels in "fit content" mode are now compatible with flexible spacers; placing one on a panel no longer causes it to slowly grow to its full width when Plasma starts up — which was hilarious, but wrong. (Niccolò Venerandi, 6.2.4. Link)
Fixed a small visual glitch in KWin's Overview effect that caused windows dragged-and-dropped onto the desktop bar to strangely glide off screen. (Marco Martin, 6.2.4. Link)
Did a major code refactor and bug-fixing spree for desktop icon positioning, which fixes almost all of the outstanding bug reports about icons moving around, and also adds autotests to validate the fixes! You can read more about it here, too. (Akseli Lahtinen, 6.3.0. Link)
Alt key accelerators for items in the Global Menu widget now work on Wayland. (Nicolas Fella, 6.3.0. Link)
Performing a major system update using Discover no longer makes a pointless and invisible authentication prompt appear behind the logout window when you try to reboot to complete the update. (Alessandro Astone, PackageKit 1.3.1. Link)
Other bug information of note:
- 4 Very high priority Plasma bug (same as last week). Current list of bugs
- 37 15-minute Plasma bugs (down from 40 last week). Current list of bugs
- 106 KDE bugs of all kinds fixed over the last week. Full list of bugs
The feature to let you record the screen without re-approval if it's the same as one you did last time now also works when using rectangular region recordings. (David Redondo, 6.3.0. Link)
Implemented support for the Wayland system bell protocol. (David Redondo, 6.3.0. Link)
How You Can HelpKDE has become important in the world, and your time and contributions have helped us get there. As we grow, we need your support to keep KDE sustainable.
You can help KDE by becoming an active community member and getting involved somehow. Each contributor makes a huge difference in KDE — you are not a number or a cog in a machine!
You don’t have to be a programmer, either. Many other opportunities exist:
- Filter and confirm bug reports, maybe even identify their root cause
- Contribute designs for wallpapers, icons, and app interfaces
- Design and maintain websites
- Translate user interface text items into your own language
- Promote KDE in your local community
- …And a ton more things!
You can also help us by donating to our yearly fundraiser! Any monetary contribution — however small — will help us cover operational costs, salaries, travel expenses for contributors, and in general just keep KDE bringing Free Software to the world.
To get a new Plasma feature or a bugfix mentioned here, feel free to push a commit to the relevant merge request on invent.kde.org.
Oliver Davies' daily list: Discussing Drush and Laravel Prompts with Jess Archer
In this week's Beyond Blocks podcast episode, I spoke to Jess Archer - Engineering Team Lead at Laravel.
We discuss Laravel Prompts which was released at Laracon US last year and added to Drush 13, but also about PHP, Laravel, Neovim, working in the terminal and bullet journaling.
Qt Wayland Tablet Improvents
A few weeks ago Qt 6.8 was released, delivering many fixes and improvements for our software. Some of them were contributed by yours truly, and in this post I want to highlight some of them.
They relate to graphics tablet/stylus input on Wayland. Before we go into the fixes let’s have a quick overview of the flow of tablet input events on Wayland:
The genesis of input events is in the kernel driver for the particular tablet, which talks to the hardware (via USB, bluetooth etc). The kernel passes events to userspace via the evdev system. On the userspace side a Wayland compositor reads those events. Most compositors leverage libinput for this, a library that transforms raw evdev events into something more usable for the compositor while applying some cleaning and configuration. The compositor then delivers events to native Wayland applications using the tablet-v2 protocol. For legacy XWayland applications the compositor uses this protocol to send events to XWayland, which translates them into things X11 apps understand. The compositor can apply useful transformations to the input, like which area of the screen the tablet is mapped to, changing the pressure curve of the pen, or binding buttons to keyboard shortcuts.
The application then processes the events, potentially leveraging a UI toolkit like Qt. Qt creates QTabletEvent object for incoming Wayland events and delivers those to all UI elements. In case no UI element reacts to the event Qt will synthesize a mouse event from the tablet event and deliver that to the UI elements. That way most controls like buttons and menus don’t need special code to handle tablet input. Only when doing very low-level input handling or when needing tablet-specific interactions (like reacting to different pressure values) application developers need to explicitly handle tablet events in their code. Most UI toolkits will work somewhat similar to this. If an application doesn’t react to tablet input at all please file a bug against the application.
Qt Wayland had support for tablet input for a few years now, so what exactly needed fixing? The first thing is cursors. In Wayland the application tells the compositor which cursor to use. This can be done either by specifying a surface (i.e. an image) or a named cursor shape. Guess which one Qt used? That’s right: Neither. It just didn’t specify a cursor at all. The result depends on the compositor: KWin would display a cross-hair cursor as a fallback, which is ~okay, but not the cursor the application developer asked for. On other compositors I’ve tested there will be no cursor visible at all, which isn’t okay at all. For Qt 6.8 I implemented the missing cursor support, so now tablets get the same cursor as mouse input (unless of course the application developer wants a different cursor for tablet input).
Another thing that affected mostly non-Plasma users is client-side decorated windows. On Plasma Qt applications usually use the server-side decoration provided by KWin, but e.g. on GNOME Qt is responsible for drawing and handling window decorations. For this Qt features a plugin system so different decorations with different look-and-feels can be swapped out. Unfortunately those decorations didn’t handle tablet input at all, so it wasn’t possible to move around or close windows using a tablet stylus. I fixed this by pretending the tablet input is mouse input to the decorations, which was a simple yet effective solution for the issue. If there is ever a need for decorations to treat tablet input different to mouse input we can revisit this.
Talking about moving windows, a feature most KDE apps have (even if off-by-default these days) is dragging any empty area to move the window. This wasn’t working when using a stylus. Why? For that we need to look at how this works on a Wayland level. The xdg-shell protocol (the one responsible for most application windows) has a move request that asks the compositor to start a move interaction for the window. As part of the request the application must pass a serial, which is a number that corresponds to the last input event the application has received. To avoid applications suddenly deciding to move in the background compositors usually only allow move requests as a result of direct user input, so this serial must match the last input event. Qt wraps this move request inside the QWindow::startSystemMove function. The problem was that Qt didn’t keep track of the serial it received as part of tablet input, so when starting the move it would pass a wrong serial and the compositor (rightfully) refused the move. A few extra lines later the serial was tracked properly and moving windows with a stylus worked, just in time for Nate to disable the feature by default.
The same problem also affected drag-and-drop. When starting a drag with a stylus Qt now passes the correct serial, making drag-and-drop work (at least on the Qt side, there currently is a bug on the KWin side that prevents this from working).
The last fix for today relates to how applications react to the tablet events. Sometimes applications process clicks differently depending on what keyboard modifiers are pressed. For example pressing Ctrl while clicking on files in Dolphin allows to select multiple files. For this to work Qt conveniently delivers the active modifiers with every input event. Alas for tablet input the modifiers got lost along the way, so it wasn’t possible to select multiple files using a stylus. One small fix later it works as expected.
That’s all the Wayland tablet related fixes for today. If you find more issues in Qt/KDE apps related to tablet input on Wayland please report them on bugs.kde.org and I’ll look into them.
That’s not all there is about Wayland tablet improvements though. Fully in the spirit of the “We care about your input!” Goal there are exiting things happening on the KWin/Plasma side that I’ve been involved in. Stay tuned for more!
In my position of Software Platform Engineer at KDE I work on common building blocks for KDE software, like Qt and KDE Frameworks. This work is possible thanks to your generous donations. Check out our end-of-the-year fundraiser if you’d like to see more work like this.
FSF Blogs: Nothing says end of the year like new GNU Press gear!
Nothing says end of the year like new GNU Press gear!
KDE Gear 24.12 branches created
Make sure you commit anything you want to end up in the KDE Gear 24.12
releases to them
Next Dates:
- November 14, 2024: 24.12 freeze and beta (24.11.80) tagging and release
- November 28, 2024: 24.12 RC (24.11.90) tagging and release
- December 5, 2024: 24.12 tagging
- December 12, 2024: 24.12 release
mark.ie: My LocalGov Drupal contributions for week-ending November 8th, 2024
I created a dashboard for testing multiple URLs at the same time using Axe.
Web Review, Week 2024-45
Let’s go for my web review for the week 2024-45.
Voted in America? This Site Doxed YouTags: tech, democracy
I didn’t know the voting rolls were public record in the US… this is a really bad idea.
https://www.404media.co/voted-in-america-this-site-doxed-you/
Tags: tech, networking, security, protocols
Looks like there are people out there to get Tor relays down… and they found a smart networking trick I’d expect to not work anymore.
https://delroth.net/posts/spoofed-mass-scan-abuse/
Tags: tech, xmpp, ux
Could XMPP make a come back if the user experience was better?
https://adele.pages.casa/md/blog/xmpp-the-forgotten-gem-of-instant-messaging.md
Tags: tech, protocols, fediverse, governance, decentralized
Interesting explanation of the different visions and governance behind ActivityPub and ATProto.
https://fediversereport.com/a-conceptual-model-of-atproto-and-activitypub/
Tags: tech, syncing, data
Interesting dimensions to use when classifying syncing solutions and to see which ones will meet your constraints.
https://stack.convex.dev/a-map-of-sync
Tags: tech, databases, data-science
A good reminder that I should probably evaluate DuckDB for some of my tooling.
https://pgrs.net/2024/11/01/duckdb-over-pandas-polars/
Tags: tech, systemd, embedded
This is a good point. systemd is kind of turning into a monoculture, but what are we loosing? Indeed, right now things could be better on deeply embedded systems (I insist on the “deep embedded” here which is often more limited in resources). Unlike the author I think they could be improved and they don’t quite apply to a good chunk of recent embedded platforms though.
https://kevinboone.me/systemd_embedded.html
Tags: tech, databases, sqlite, tools, syncing
If you wonder how the protocol is designed and how the actual implementation works, this is a nice introduction. Clearly it’s helped by the size of that program which is fairly small.
https://nochlin.com/blog/how-the-new-sqlite3_rsync-utility-works
Tags: tech, c++, complexity
Good illustration of how the C++ language complexity is out of hands.
https://azeemba.com/posts/cpp-complexity-compiler-bugs.html
Tags: tech, c++
Still, C++ improved in recent years. The problem is that we tend to stick too much to the old constructs we already know and that things keep piling up but nothing is removed.
https://lemire.me/blog/2024/11/02/having-fun-with-modern-c/
Tags: tech, html, accessibility, low-tech, complexity
A nice subset of HTML to ensure better accessibility and reduced complexity.
https://smolweb.org/specs/index.html
Tags: tech, web, frontend, html
Each has a use, they shouldn’t be conflated. It makes for poor user experience and accessibility otherwise.
https://marijkeluttekes.dev/blog/articles/2024/11/04/html-link-or-button-that-is-the-question/
Tags: tech, remote-working, management, product-management
A bit biased toward stable product teams only. Still, there are good tips which are more widely applicable here. This gives a good idea of the management of a distributed team of remote workers.
https://matt.blwt.io/post/long-distance-relationships/
Bye for now!
Thomas Lange: Using NIS (Network Information Service) in 2024
The topic of this posting already tells you that an old Unix guy tells stories about old techniques.
I'm a happy NIS (formerly YP) user since 30+ years. I started using it with SunOS 4.0, later using it with Solaris and with Linux since 1999.
In the past, a colleague wasn't happyly using NIS+ when he couldn't log in as root after a short time because of some well known bugs and wrong configs. NIS+ was also much slower than my NIS setup. I know organisations using NIS for more than 80.000 user accounts in 2024.
I know the security implications of NIS but I can live with them, because I manage all computers in the network that have access to the NIS maps. And NIS on Linux offers to use shadow maps, which are only accessible to the root account. My users are forced to use very long passwords.
Unfortunately NIS support for the PAM modules was removed in Debian in pam 1.4.0-13, which means Debian 12 (bookworm) is lacking NIS support in PAM, but otherwise it is still supported. This only affects changing the NIS password via passwd. You can still authenticate users and use other NIS maps.
But yppasswd is deprecated and you should not use it! If you use yppasswd it may generate a new password hash by using the old DES crypt algorithm, which is very weak and only uses the first 8 chars in your password. Do not use yppasswd any more! yppasswd only detects DES, MD5, SHA256 and SHA512 hashes, but for me and some colleagues it only creates weak DES hashes after a password change. yescrypt hashes which are the default in Debian 12 are not supported at all. The solution is to use the plain passwd program.
On the NIS master, you should setup your NIS configuration to use /etc/shadow and /etc/passwd even if your other NIS maps are in /var/yp/src or similar. Make sure to have these lines in your /var/yp/Makefile:
PASSWD = /etc/passwd SHADOW = /etc/shadowCall make once, and it will generate the shadow and passwd map. You may want to set the variable MINUID which defines which entries are not put into the NIS maps.
On all NIS clients you still need the entries (for passwd, shadow, group,...) that point to the nis service. E.g.:
passwd: files nis systemd group: files nis systemd shadow: files nisYou can remove all occurences of "nis" in your /etc/pam.d/common-password file.
Then you can use the plain passwd program to change your password on the NIS master. But this does not call make in /var/yp for updating the NIS shadow map.
Let's use inotify(7) for that. First, create a small shell script /usr/local/sbin/shadow-change:
#! /bin/sh PATH=/usr/sbin:/usr/bin # only watch the /etc/shadow file if [ "$2" != "shadow" ]; then exit 0 fi cd /var/yp || exit 3 sleep 2 makeThen install the package incron.
# apt install incron # echo root >> /etc/incron.allow # incrontab -eAdd this line:
/etc IN_MOVED_TO /usr/local/sbin/shadow-change $@ $# $%It's not possible to use IN_MODIFY or watch other events on /etc/shadow directly, because the passwd command creates a /etc/nshadow file, deletes /etc/shadow and then moves nshadow to shadow. inotify on a file does not work after the file was removed.
You can see the logs from incrond by using:
# journalctl _COMM=incrond e.g. Oct 01 12:21:56 kueppers incrond[6588]: starting service (version 0.5.12, built on Jan 27 2023 23:08:49) Oct 01 13:43:55 kueppers incrond[6589]: table for user root created, loading Oct 01 13:45:42 kueppers incrond[6589]: PATH (/etc) FILE (shadow) EVENT (IN_MOVED_TO) Oct 01 13:45:42 kueppers incrond[6589]: (root) CMD ( /usr/local/sbin/shadow-change /etc shadow IN_MOVED_TO)I've disabled the execution of yppasswd using dpkg-divert
# dpkg-divert --local --rename --divert /usr/bin/yppasswd-disable /usr/bin/yppasswd chmod a-rwx /usr/bin/yppasswd-disableDo not forget to limit the access to the shadow.byname map in ypserv.conf and general access to NIS in ypserv.securenets.
I've also discovered the package pamtester, which is a nice package for testing your pam configs.
Pages
Recent Publications
- Managing Hidden Dependencies in OO Software: a Study Based on Open Source Projects
- Open Source Communities as Liminal Ecosystems
- Investigating developers' email discussions during decision-making in Python language evolution
- Developers, Quality Control and Download Volume in Open Source Software (OSS) Projects
FLOSS Project Planets
FLOSS Research
- Open Data and Open Source AI: Charting a course to get more of both
- The Open Source Initiative and the Eclipse Foundation to Collaborate on Shaping Open Source AI (OSAI) Public Policy
- ClearlyDefined v2.0 adds support for LicenseRefs
- ClearlyDefined at SOSS Fusion 2024: a collaborative solution to Open Source license compliance
- Members Newsletter – November 2024